

Question: The left-hand side of the following graph shows market demand and supply curves in a competitive market. Draw the demand facing a competitive firm
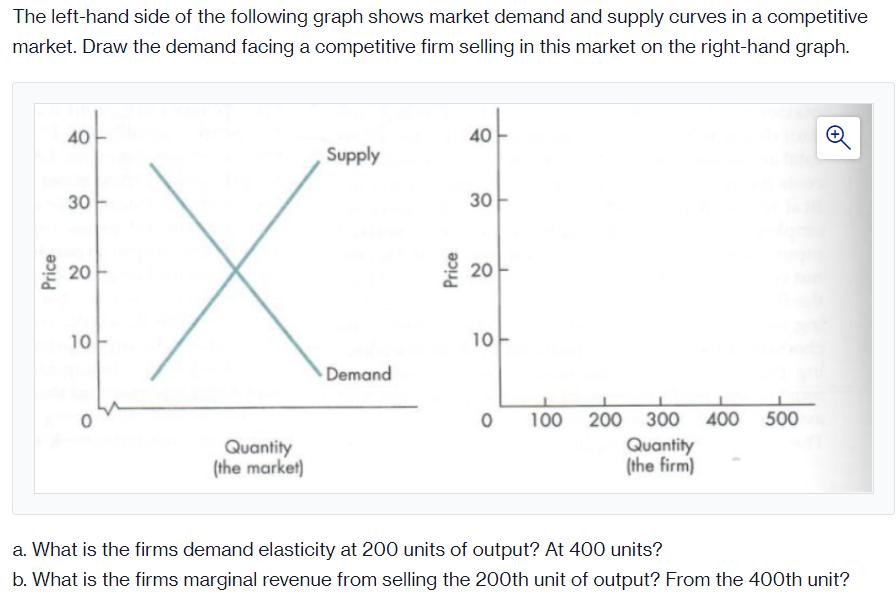
The left-hand side of the following graph shows market demand and supply curves in a competitive market. Draw the demand facing a competitive firm selling in this market on the right-hand graph. 40 40 Supply 30 30 20 20 10 10 Demand 100 200 300 400 500 Quantity (the market) Quantity (the firm) a. What is the firms demand elasticity at 200 units of output? At 400 units? b. What is the firms marginal revenue from selling the 200th unit of output? From the 400th unit? Price
Step by Step Solution
3.42 Rating (146 Votes )
There are 3 Steps involved in it
Market 80 E firms demand cUrve un demand potice elasticity of demand is given as dQ P dP ... View full answer

Get step-by-step solutions from verified subject matter experts