

Question: https://www.epa.gov/facts-and-figures-about-materials-waste-and-recycling/plastics-material- specific-data PLOT A Recycled - Composted 4% 0% Combustion with Energy O Recovery O 8% Generation 50% Landfilled 38%% O PLOT B Generation 35,680
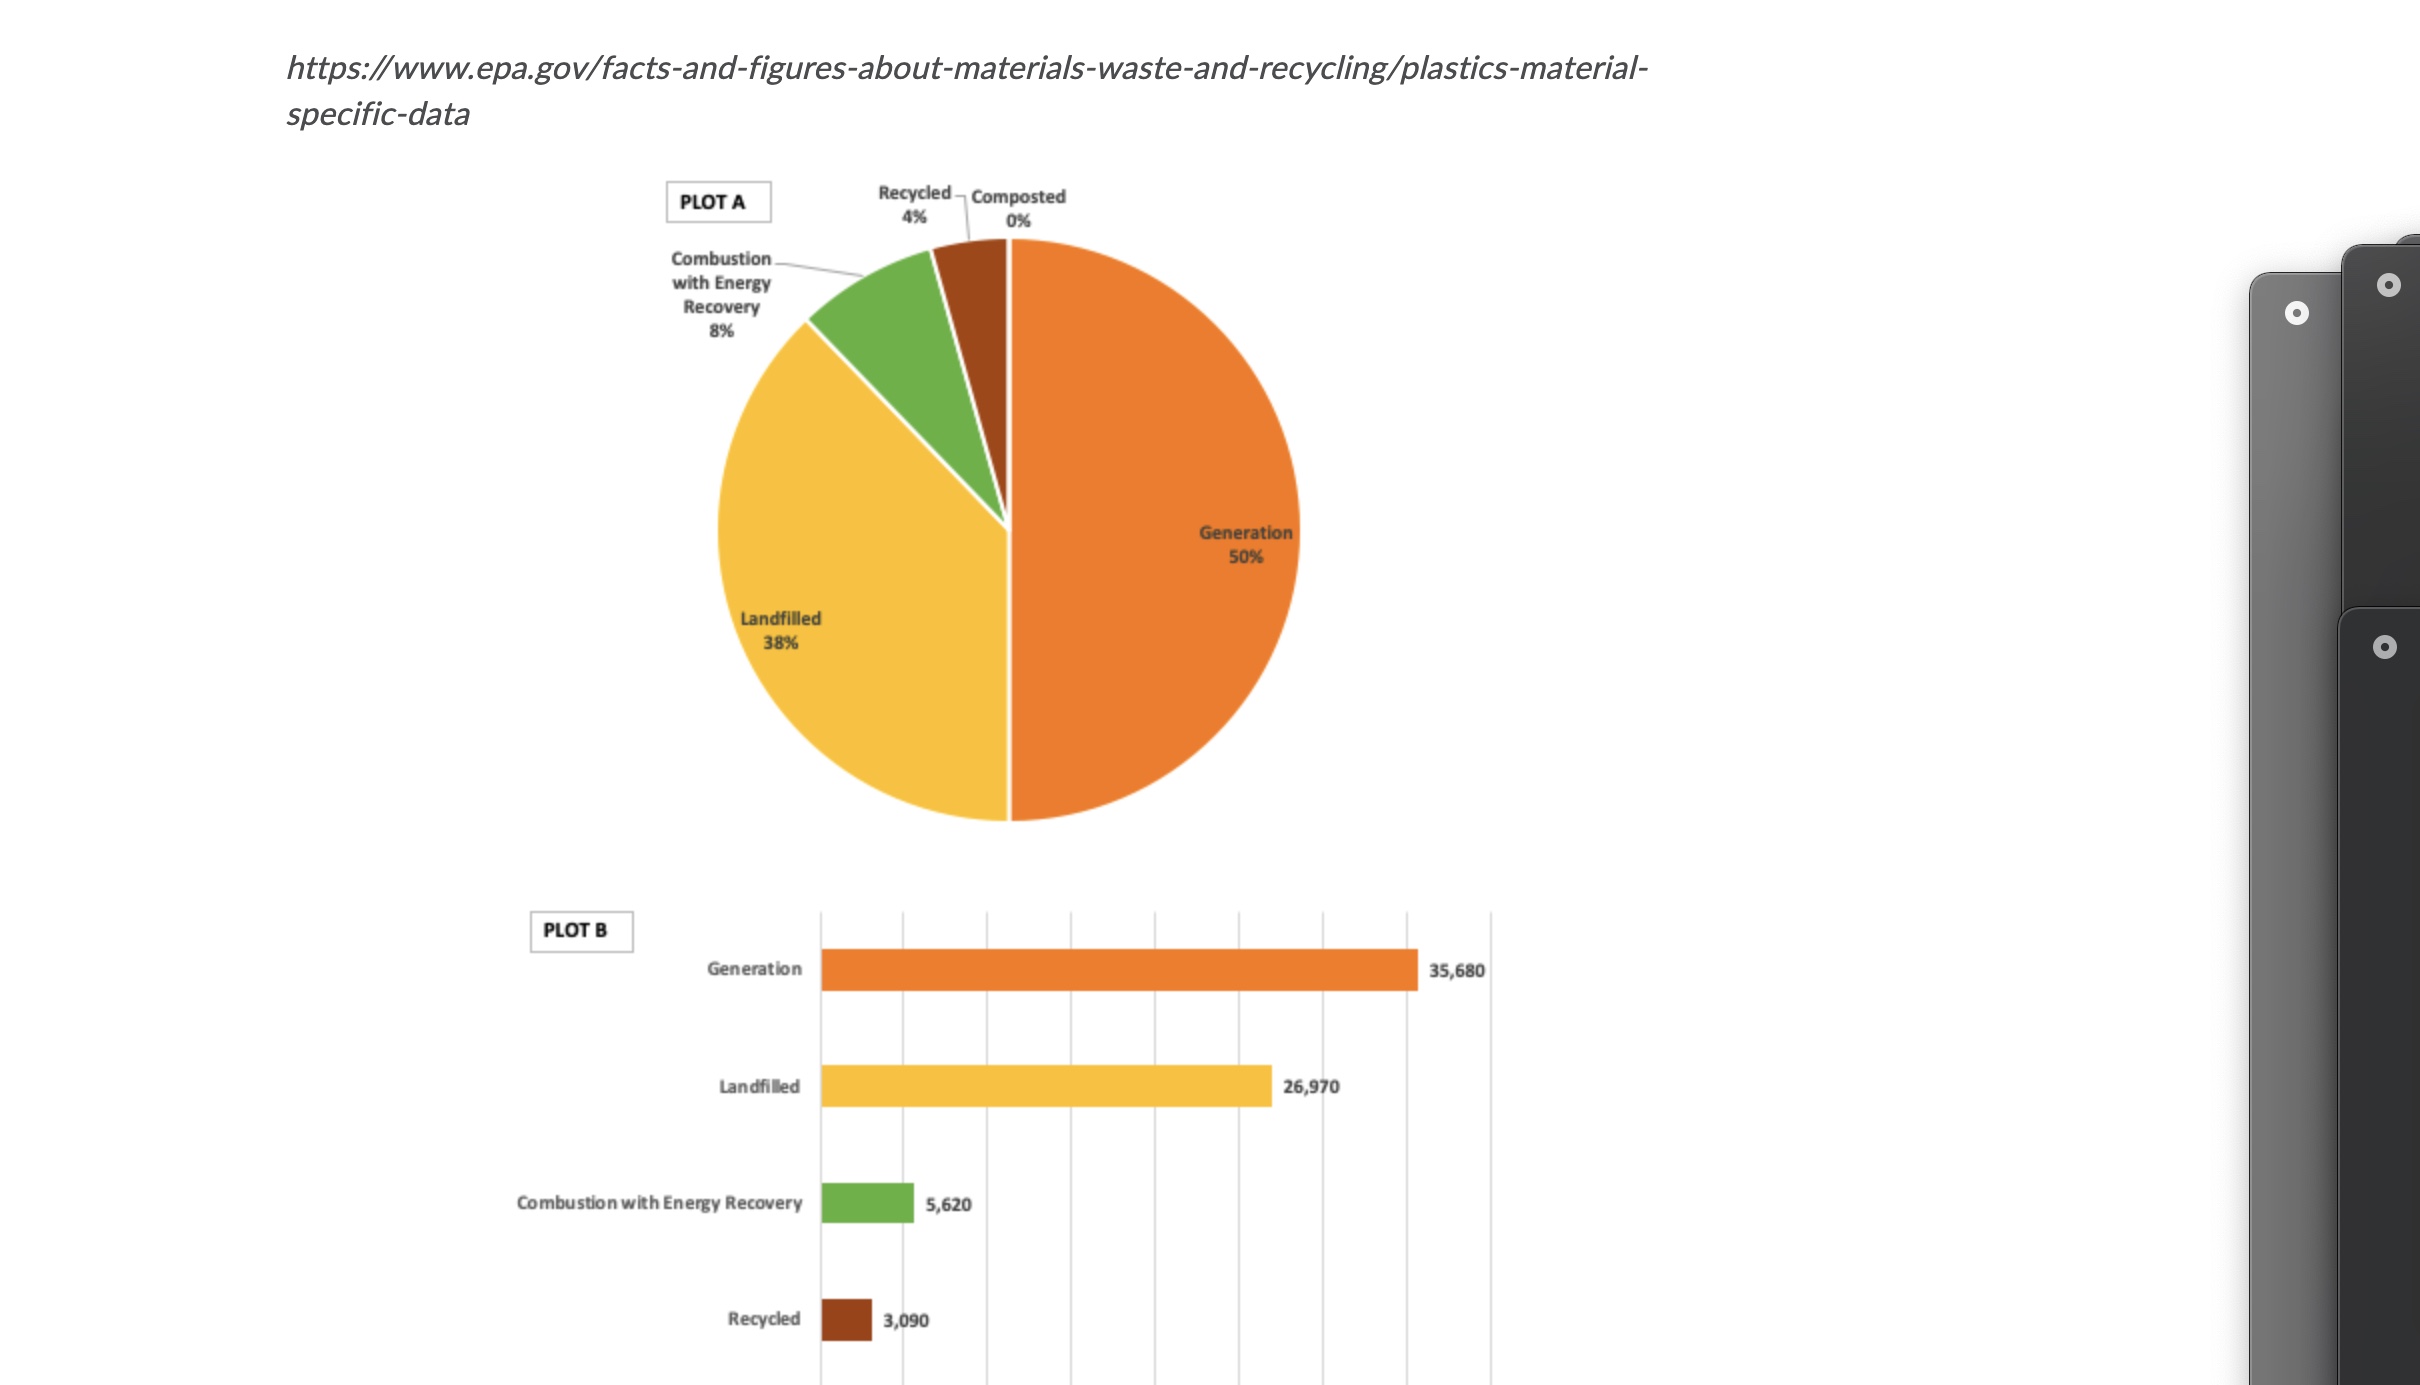
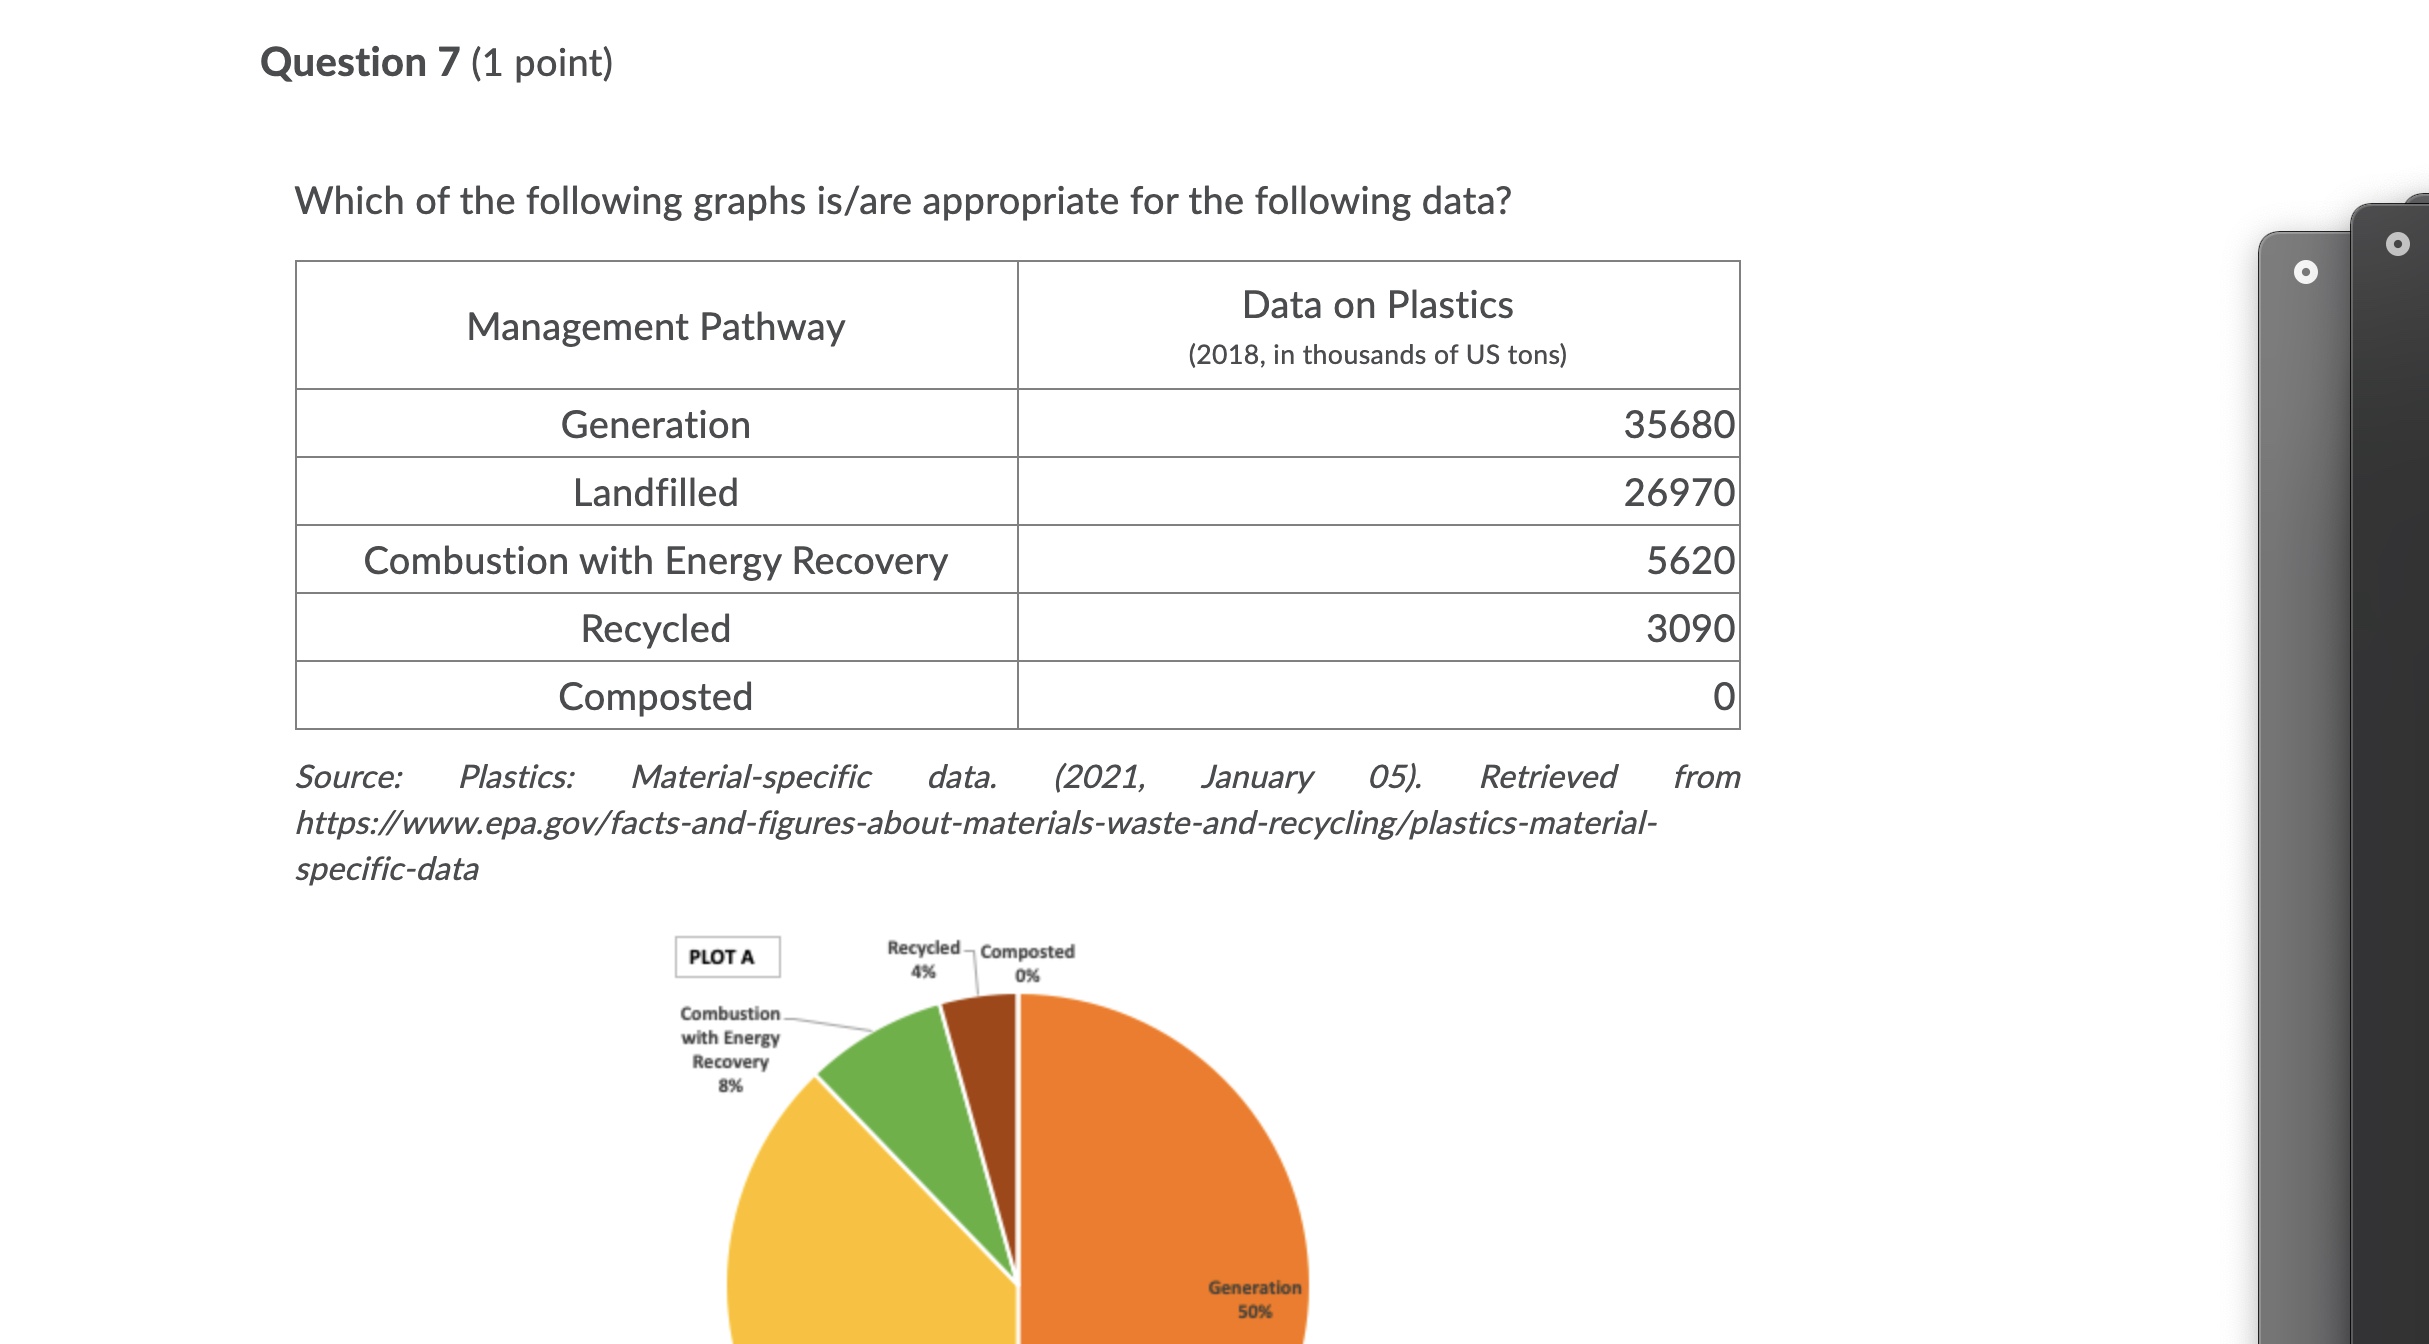
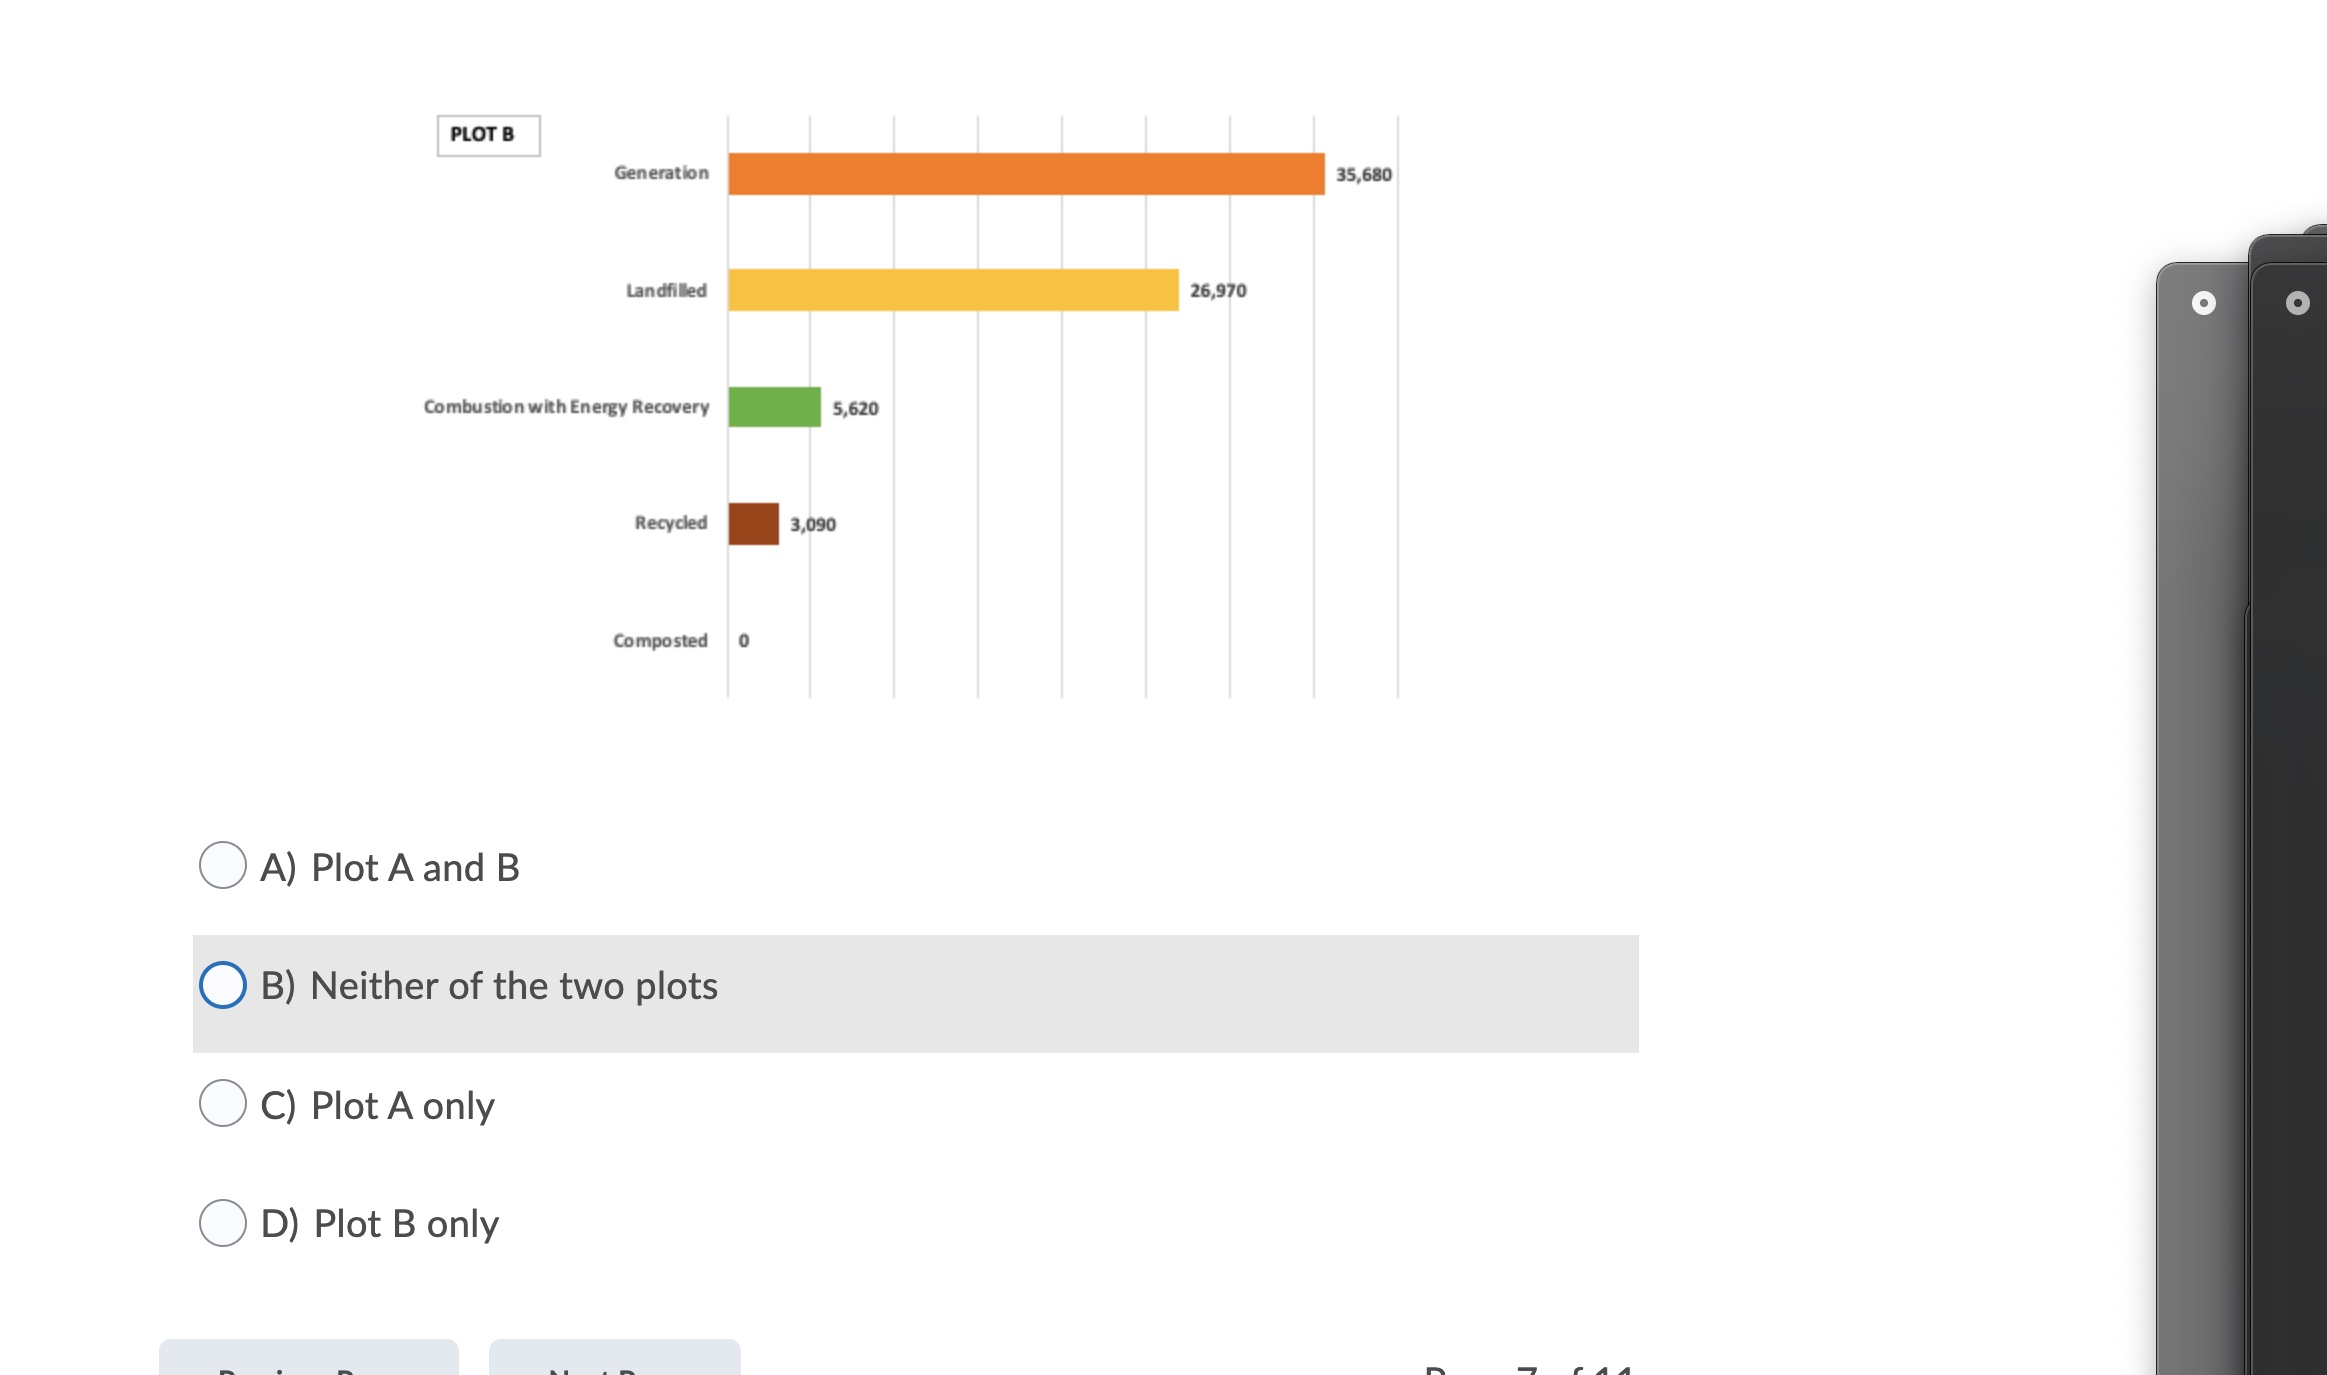


https://www.epa.gov/facts-and-figures-about-materials-waste-and-recycling/plastics-material- specific-data PLOT A Recycled - Composted 4% 0% Combustion with Energy O Recovery O 8% Generation 50% Landfilled 38%% O PLOT B Generation 35,680 Landfilled 26,970 Combustion with Energy Recovery 5,620 Recycled 3,090Question 7 (1 point) Which of the following graphs is/are appropriate for the following data? O O Management Pathway Data on Plastics (2018, in thousands of US tons) Generation 35680 Landfilled 26970 Combustion with Energy Recovery 5620 Recycled 3090 Composted 0 Source: Plastics: Material-specific data. (2021, January 05). Retrieved from https://www.epa.gov/facts-and-figures-about-materials-waste-and-recycling/plastics-material- specific-data PLOT A Recycled - Composted 4% 0% Combustion with Energy Recovery 8% Generation 50%PLOT B Generation 35,680 Landfilled 26,970 O O Combustion with Energy Recovery 5,620 Recycled 3,090 Composted 0 ( A) Plot A and B O B) Neither of the two plots O C) Plot A only ( D) Plot B only
Step by Step Solution
There are 3 Steps involved in it

Get step-by-step solutions from verified subject matter experts