

Question: https://www.limes.one/Content/DataFiles/Man_body.txt Iimes.one LlMeS-Exams hit '3 ' lll'l LiMeS - Learning Management System Jean Nelson , CRN#12216 Section 011 Boston ' 1223513519- 0 Collapse menu a
https://www.limes.one/Content/DataFiles/Man_body.txt
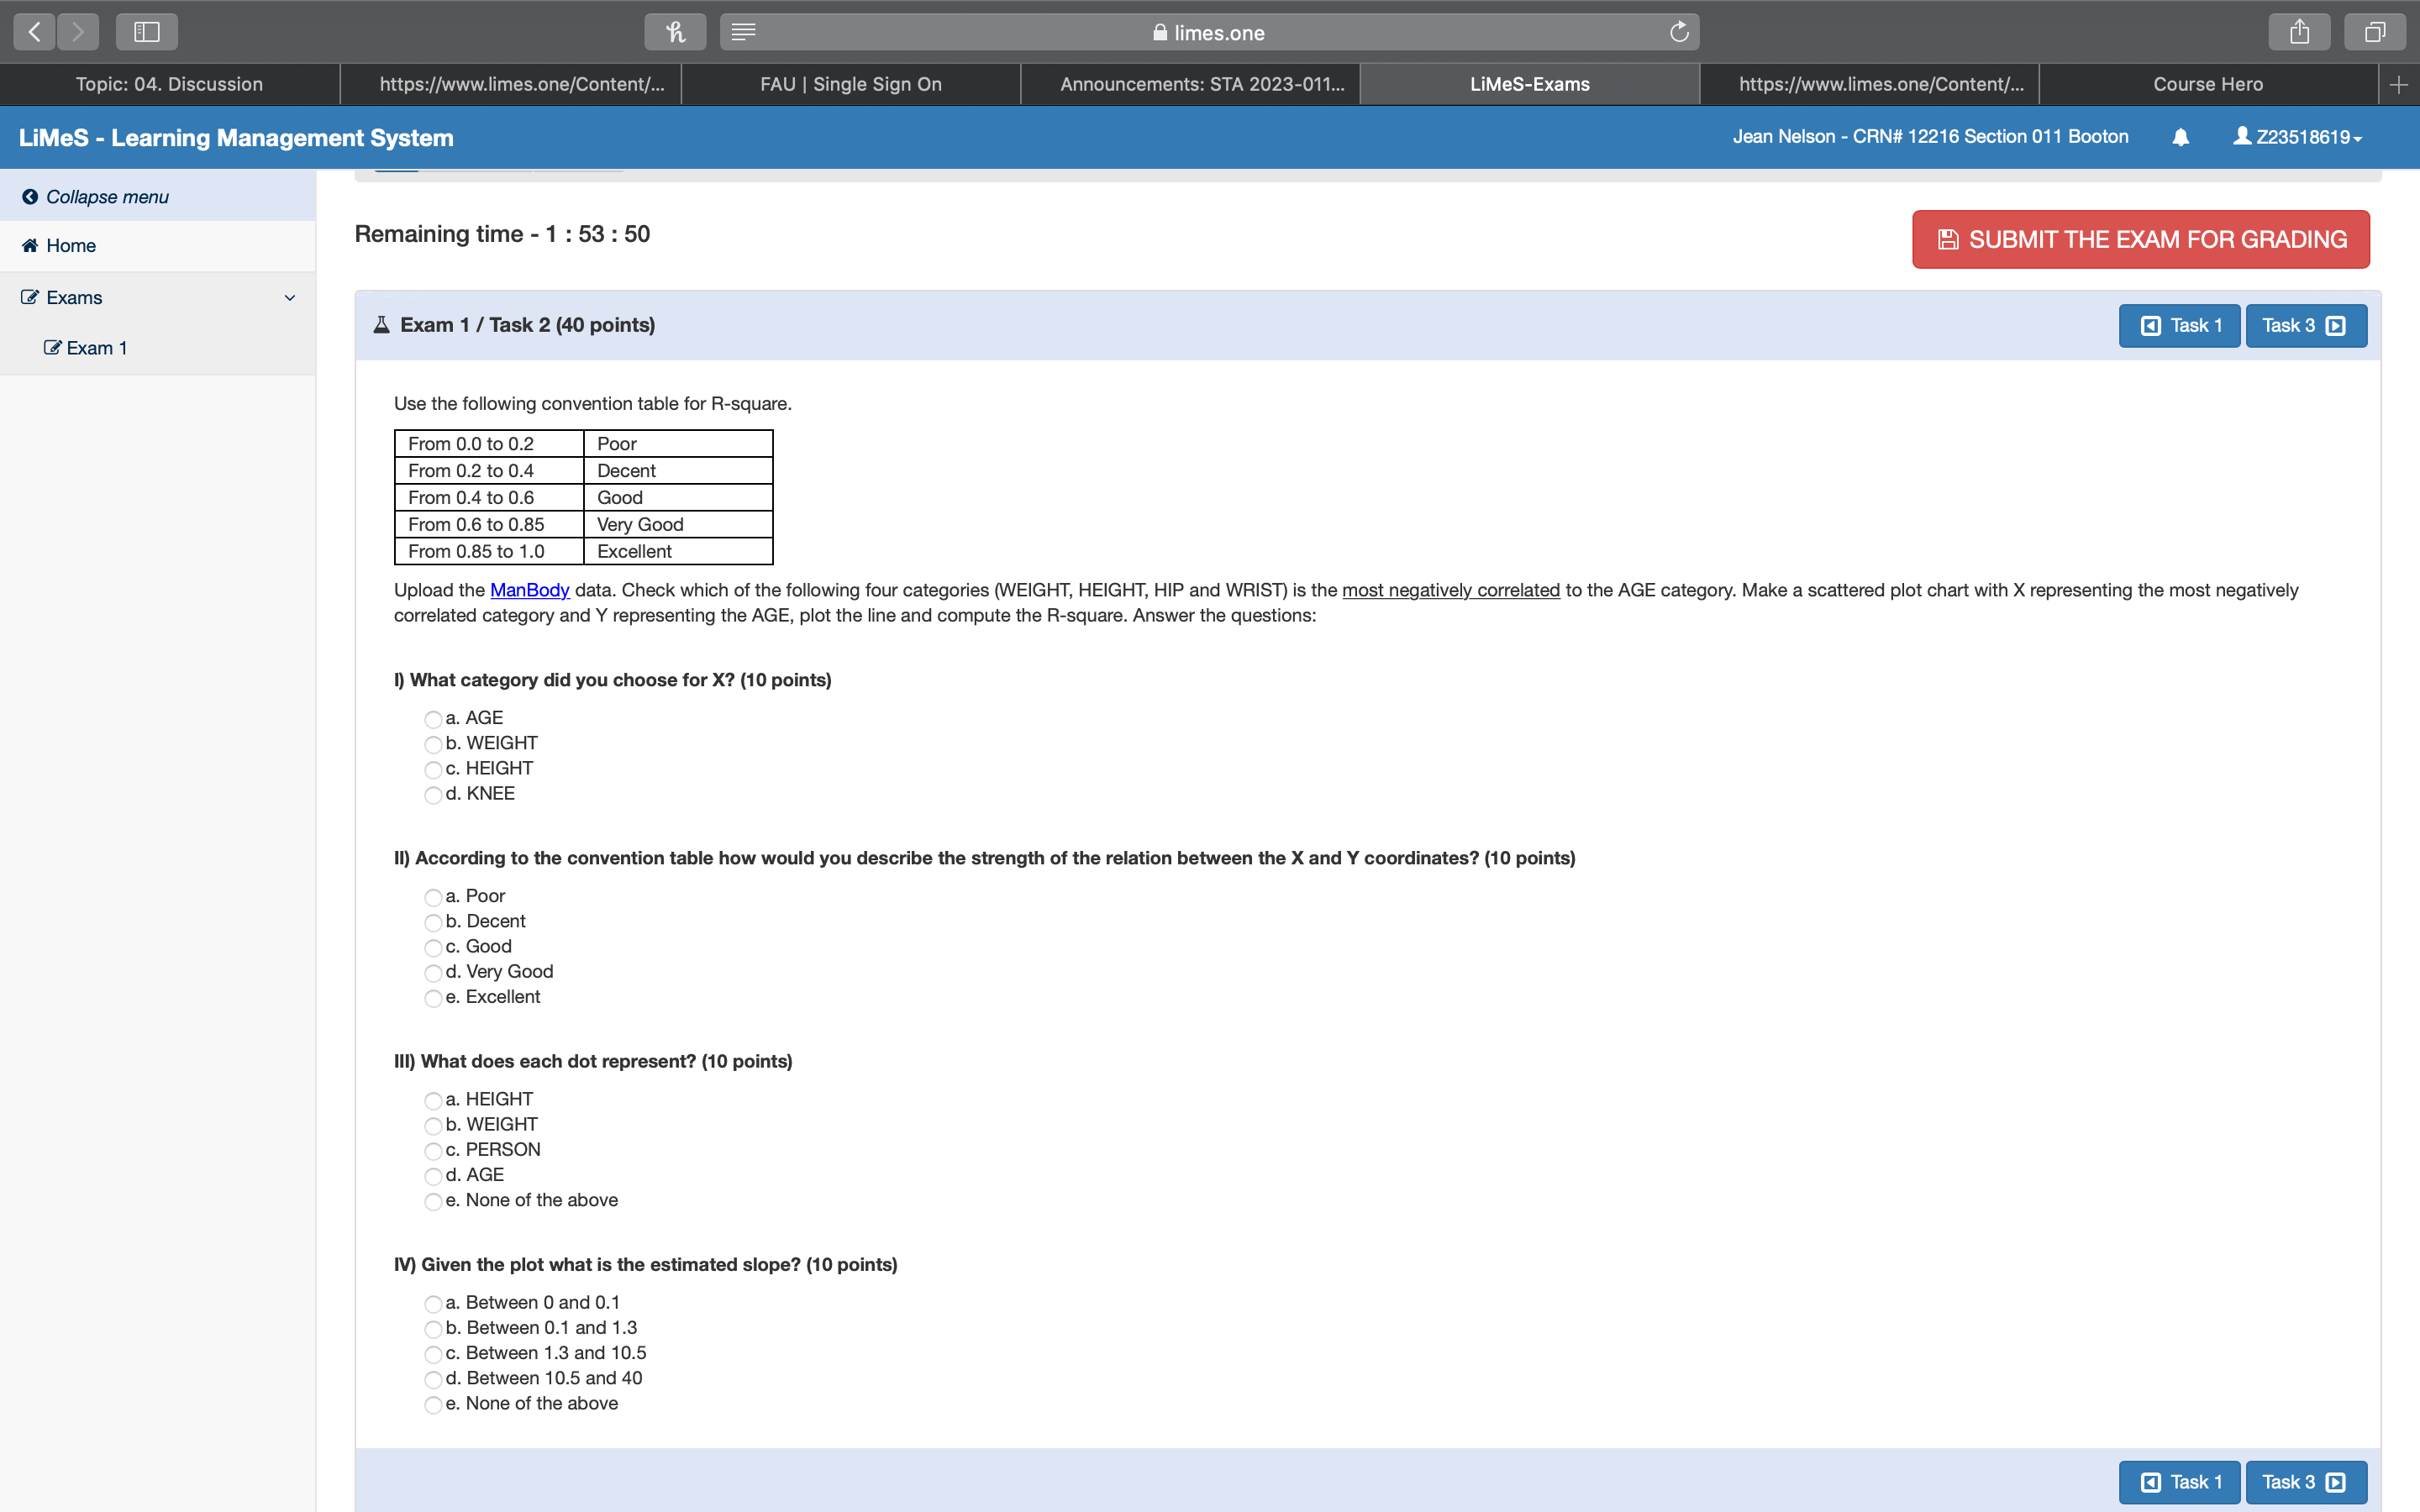
Iimes.one LlMeS-Exams hit '3 ' lll'l LiMeS - Learning Management System Jean Nelson , CRN#12216 Section 011 Boston ' 1223513519- 0 Collapse menu a Home \"mam"?! \"me '1 =53 i 5 SUBMIT THE EXAM FOR GRADING l? Exams v m................ IIExam1 Use the Iollowing convention table for R-square. From 0.0 to 0.2 Poor From 0.2 to 0.4 Decent From 0.4 to 0.6 Good From 0.6 to 0.85 Very Good From 0.55 to 1.0 Excellent Upload the ManBody data. Check which at the lollowing four categories (WEIGHT, HEIGHT, HIP and WRIST) is the most ngatively correlated to the AGE category. Make a scattered plat chart with x representing me most negatively correlated category and Y representing the AGE, plot the line and compute the Fi-equare. Answer the questions: I) What category did you choose for X7 (10 points) ' ' a. AGE "' b. WEIGHT ' C. HEIGHT ' d. KNEE II) According to the convention table how would you describe the strength of the relation between the X and Y coordinates? (10 pollute) ' a. Poor 7' b. Decent ' 0. Good "' d. Very Good ' 9. Excellent In) what does each dot represent? no points) ' a. HEIGHT ' ' b. WEIGHT "' c. PERSON ' d. AGE ' e. None of the above IV) Given the plot what I: the estimated slope? (10 points) ' a. Between 0 and 0.1 7' b. Between 0.1 and 1.3 ' 0. Between 1.3 and 10.5 "' d. Between 105 and 40 ' 9. None of the above
Step by Step Solution
There are 3 Steps involved in it

Get step-by-step solutions from verified subject matter experts