

Question: https://www.limes.one/Content/DataFiles/Wages.txt limesone LiMeS-Exams LiMeS - Learning Management System Jean Neison . CRN#12216 Section 011 Boston ' 1223518519. 0 Collapse menu Exam! 3 Tbska Home l:
https://www.limes.one/Content/DataFiles/Wages.txt
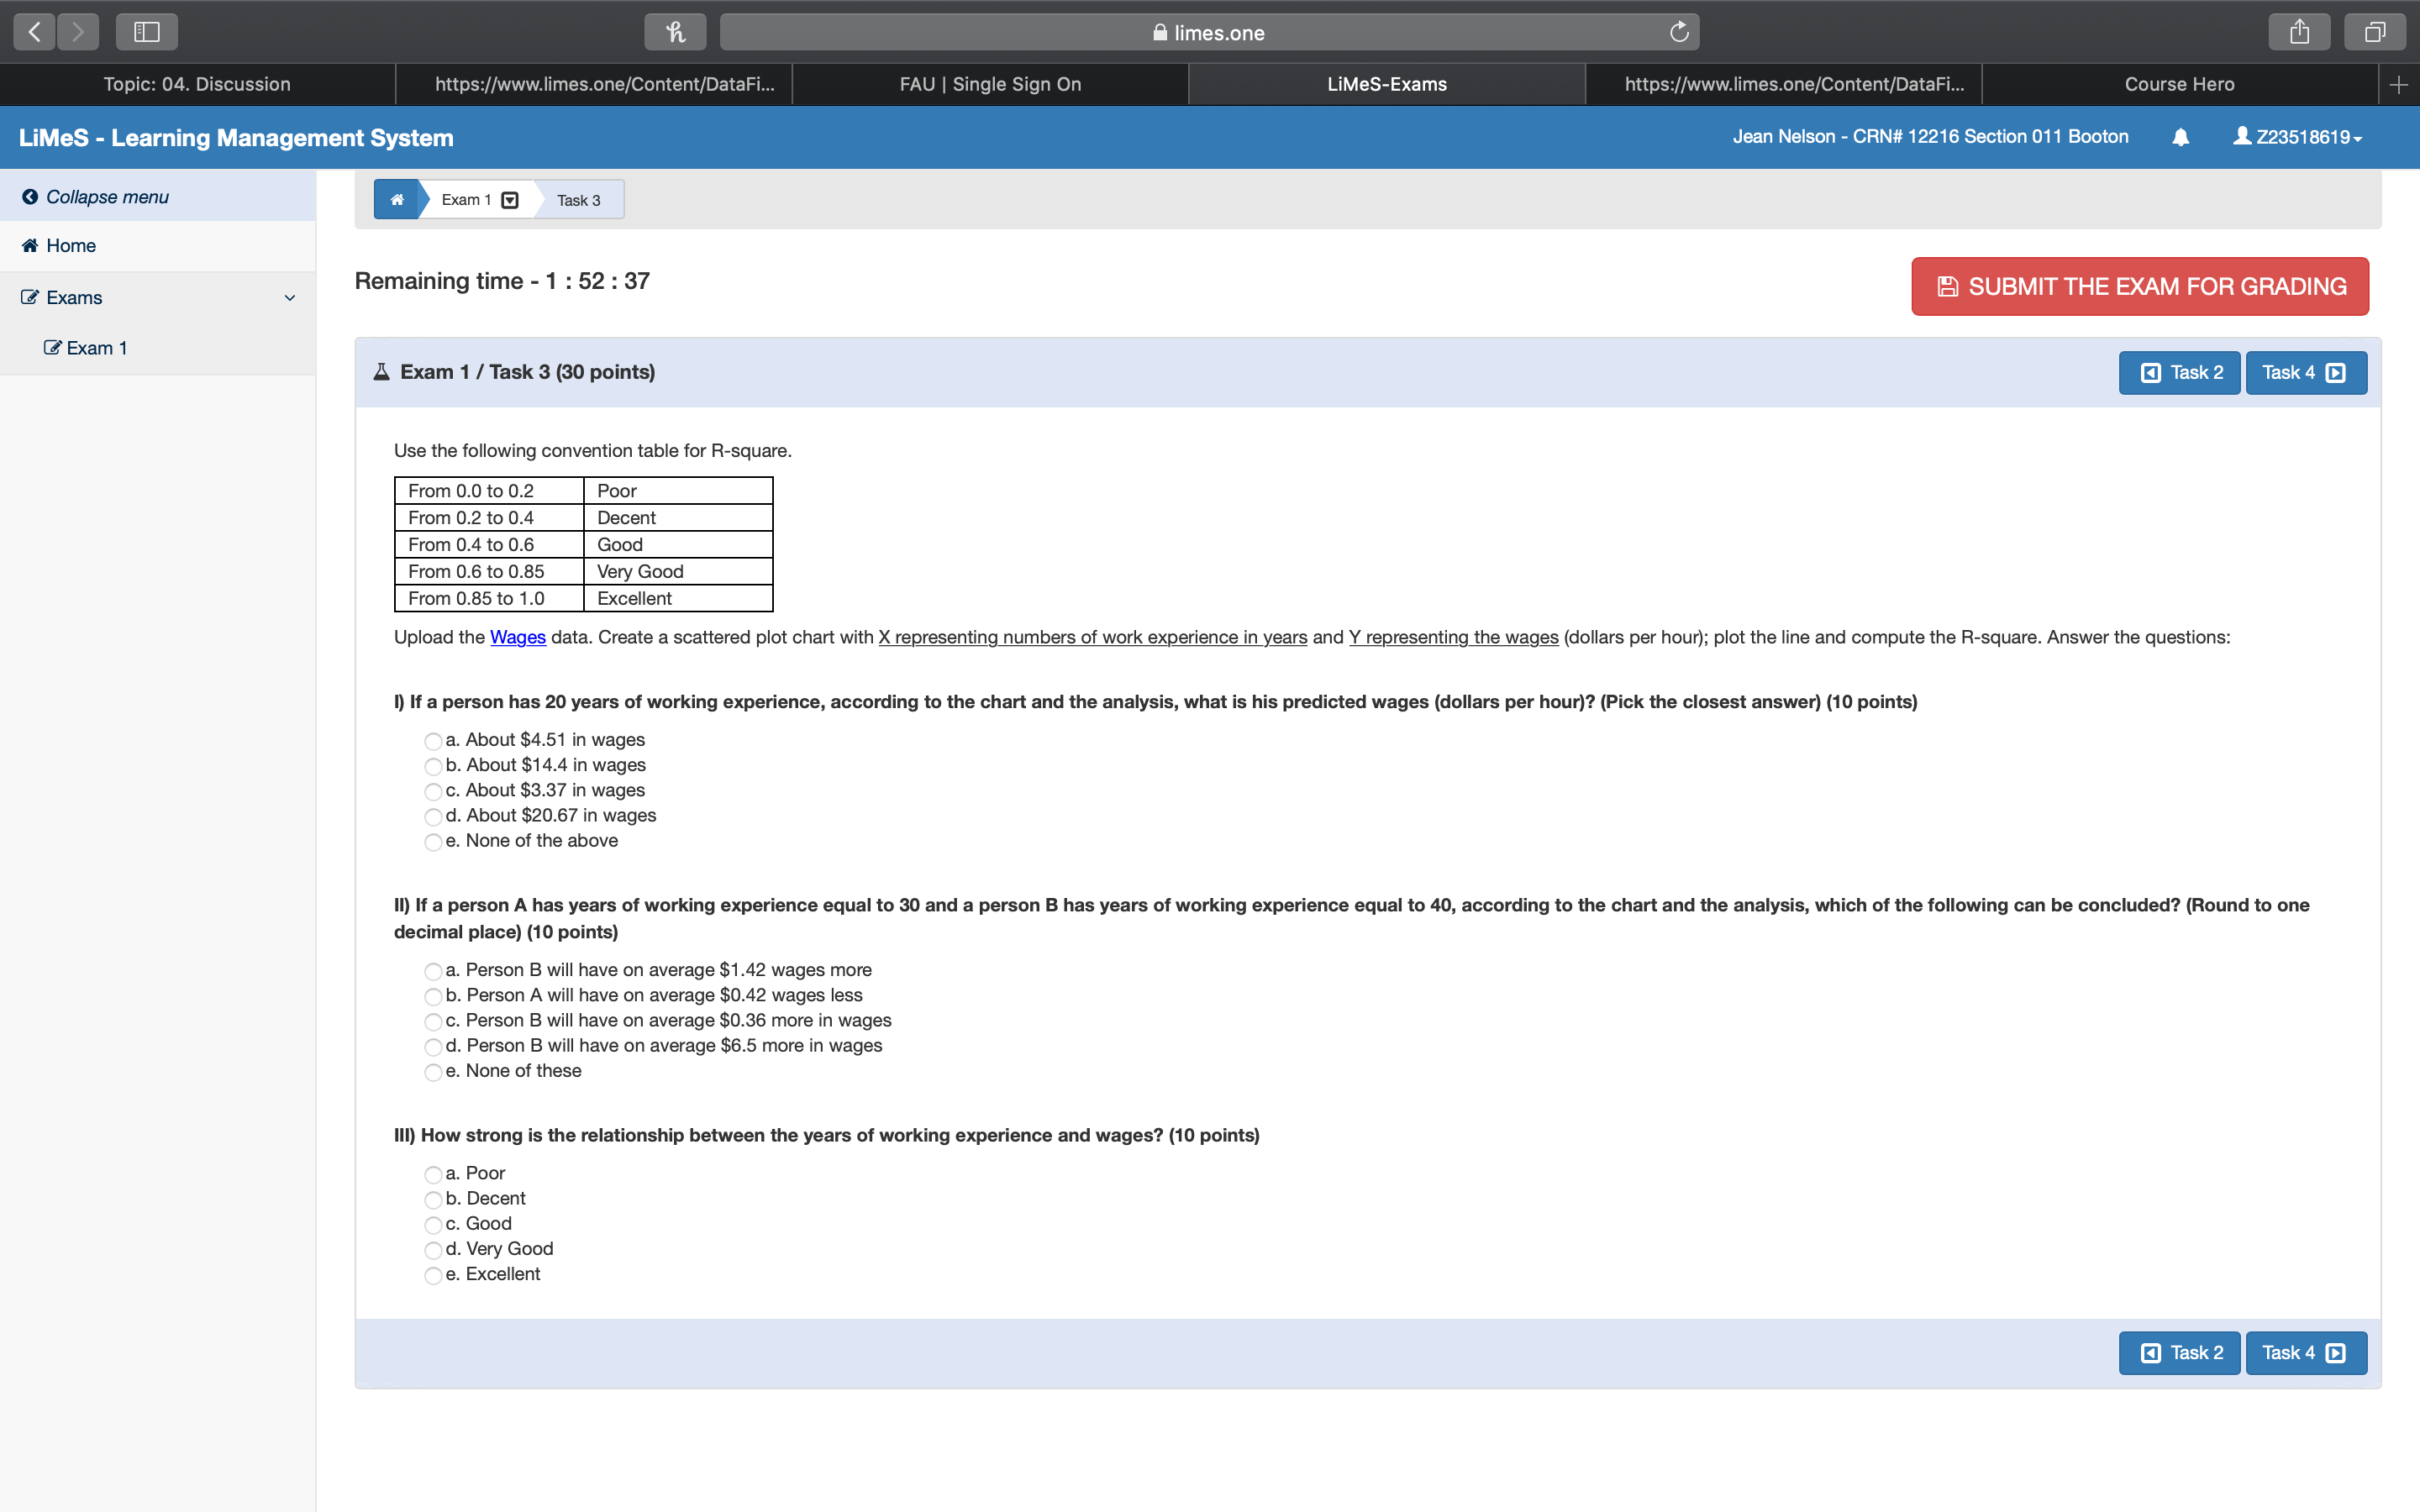
limesone LiMeS-Exams LiMeS - Learning Management System Jean Neison . CRN#12216 Section 011 Boston ' 1223518519. 0 Collapse menu Exam! 3 Tbska Home l: Exams V Remaining time -1 :52 : 37 SUBMIT THE EXAM FOR GRADING I? Exam 1 A Examine-moraine Use the iollowing convention table for Fl-square. From 0.0 to 0.2 Poor Frum [LE to 0.4 Decent Frum EA to 0.6 Good From 0.6 to 0.85 Very Good From 0.85 to 1.0 Excellent Upload the Wages data. Create a scattered plot chart with X representing numbers oi work experience in years and Y representing the wages (dollars per hour); plot the line and compute the lit-square. Answer the questions: I) it a person has 20 years at working experience, according to the chart and the analysis, what ls llls predicted wages (dollars per hour]? [Pick the closest answer] (10 points) a. About $4.51 in wages ' b. About 314.4 in wages ' c. About $3.37 in wages " d. About $20.67 in wages 9. None of the above ll) ll a person A has years or working experience equal to 30 and a person a has years of working experience equal to 40, according to the chart and lhe analysis, which of the following can be concluded? (Round to one decimal place) (10 points) ' a. Person B will have on average $1.42 wages more ' b. Person A will have on average $0.42 wages less ' c. Person B will have on average $0.36 more in wages d. Person B will have on average $6.5 more in wages ' e. None of these Ill) How strong Is the relationship between the years or working experience and wages? [10 points) ' a. Poor ' b. Decent c. Good " d. Very Good 7 9. Excellent El Task2 Task4 El
Step by Step Solution
There are 3 Steps involved in it

Get step-by-step solutions from verified subject matter experts