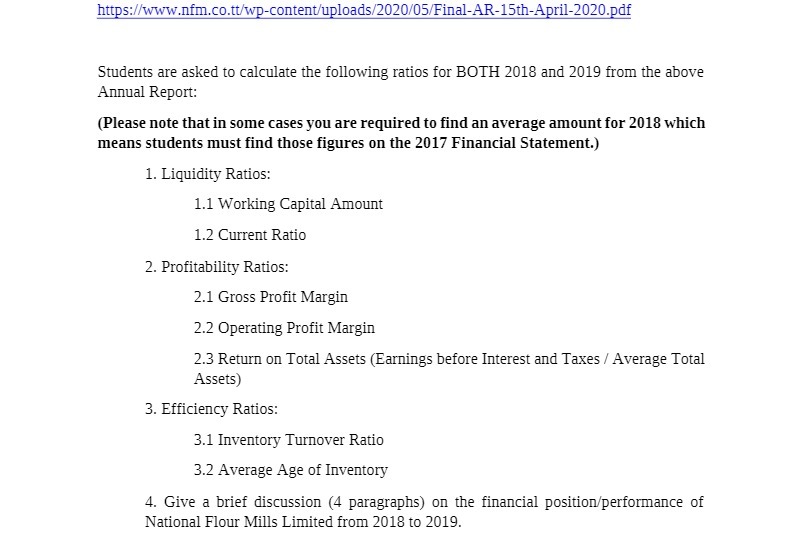
Question: https://www.nfm.co.tt/wp-content/uploads/2020/05/Final-AR-15th-April-2020.pdf Students are asked to calculate the following ratios for BOTH 2018 and 2019 from the above Annual Report: (Please note that in some cases

https://www.nfm.co.tt/wp-content/uploads/2020/05/F
https://www.nfm.co.tt/wp-content/uploads/2020/05/Final-AR-15th-April-2020.pdf Students are asked to calculate the following ratios for BOTH 2018 and 2019 from the above Annual Report: (Please note that in some cases you are required to find an average amount for 2018 which means students must find those figures on the 2017 Financial Statement.) 1. Liquidity Ratios: 1.1 Working Capital Amount 1.2 Current Ratio 2. Profitability Ratios: 2.1 Gross Profit Margin 2.2 Operating Profit Margin 2.3 Return on Total Assets (Earnings before Interest and Taxes / Average Total Assets) 3. Efficiency Ratios: 3.1 Inventory Turnover Ratio 3.2 Average Age of Inventory 4. Give a brief discussion (4 paragraphs) on the financial position/performance of National Flour Mills Limited from 2018 to 2019

Step by Step Solution

There are 3 Steps involved in it

1 Expert Approved Answer
Step: 1 Unlock blur-text-image
Question Has Been Solved by an Expert!

Get step-by-step solutions from verified subject matter experts

Step: 2 Unlock
Step: 3 Unlock

Students Have Also Explored These Related Accounting Questions!