

Question: https://www.usablestats.com/calcs/2samplet&summary=1 The table below summarizes the IQ summary of 2 groups Group A control and Group B given a pill before the test. (We will
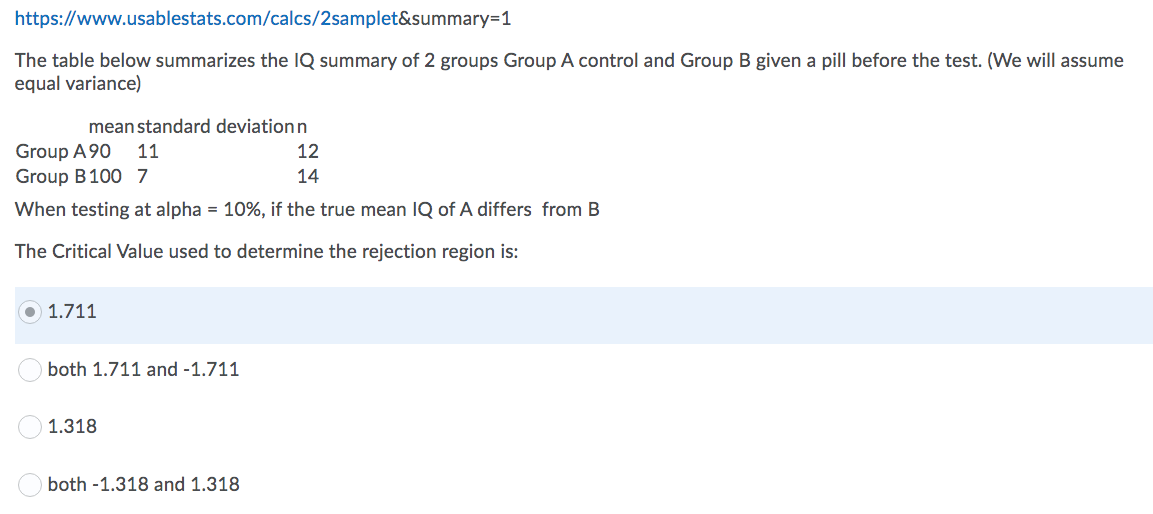
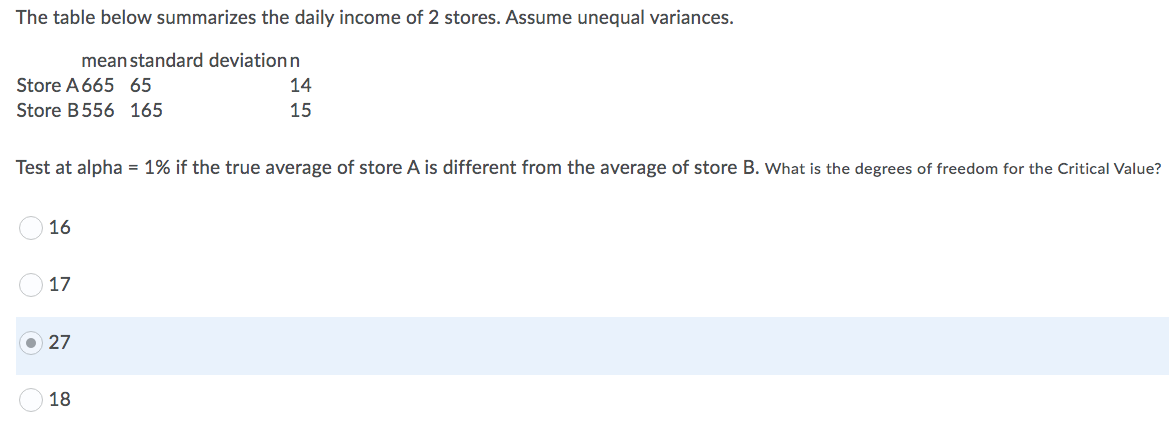
https://www.usablestats.com/calcs/2samplet&summary=1 The table below summarizes the IQ summary of 2 groups Group A control and Group B given a pill before the test. (We will assume equal variance) mean standard deviationn Group A90 11 12 Group B 100 7 14 When testing at alpha = 10%, if the true mean IQ of A differs from B The Critical Value used to determine the rejection region is: 1.711 both 1.711 and -1.711 1.318 both -1.318 and 1.318The table below summarizes the daily income of 2 stores. Assume unequal variances. mean standard deviation n Store A665 65 14 Store 8556 165 15 Test at alpha = 1% if the true average of store A is different from the average of store B. What is the degrees of freedom for the Critical Value? ' ' j 16 ' ' j 17 -:+:- 27 ":13
Step by Step Solution
There are 3 Steps involved in it

Get step-by-step solutions from verified subject matter experts