

Question: Hurry please D Question 9 7 pts The following table shows the total revenue (in dollars) and total cost (in dollars) from the production and
Hurry please
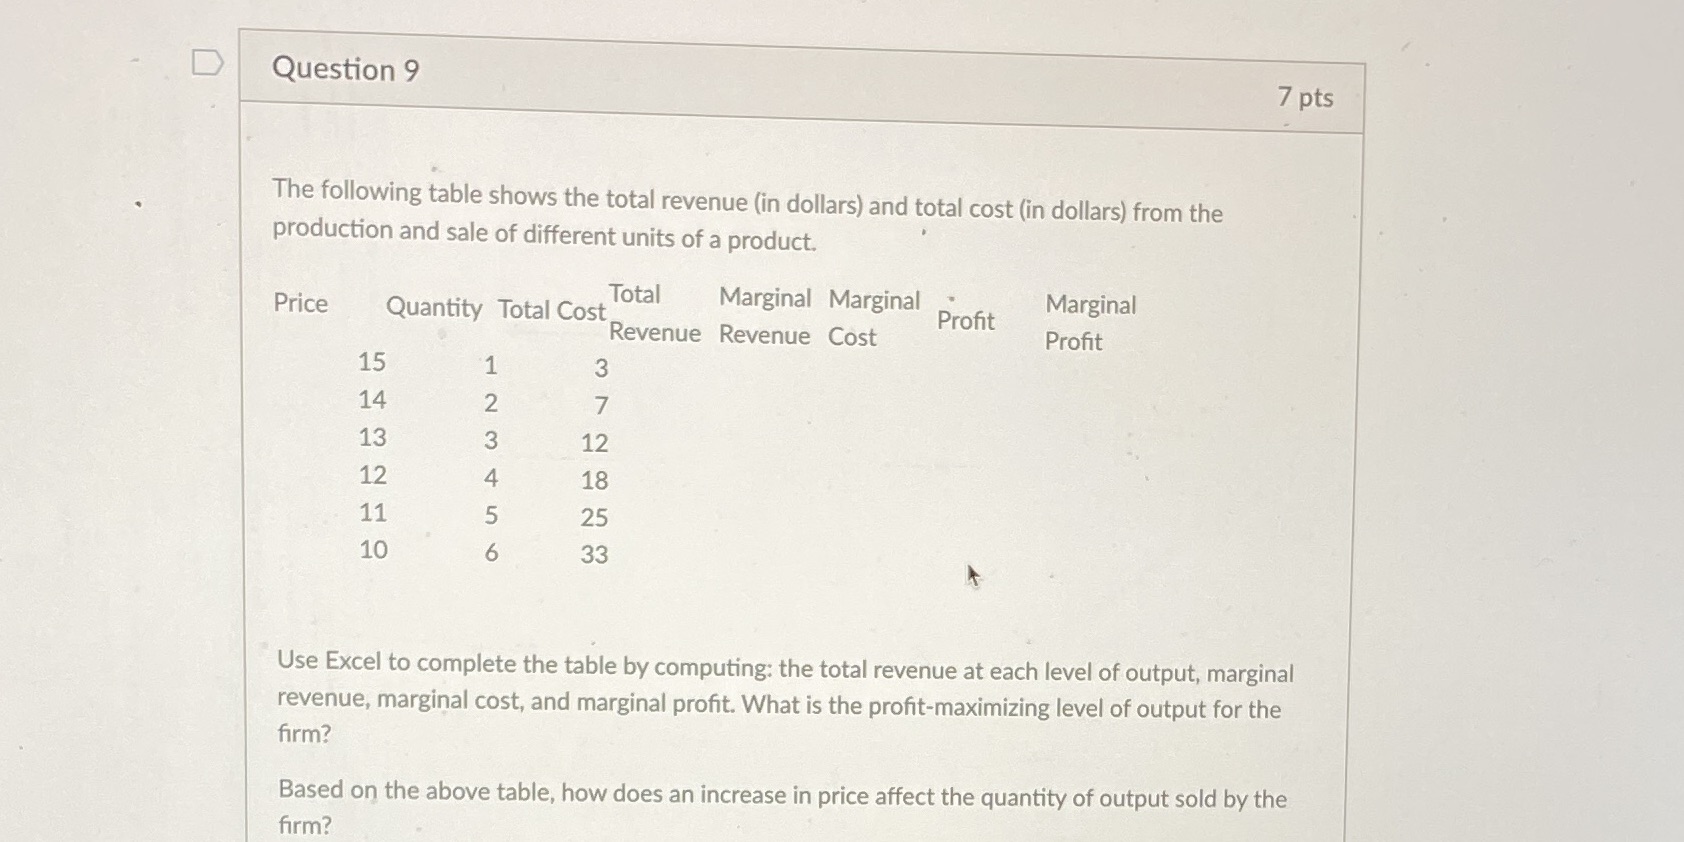
D Question 9 7 pts The following table shows the total revenue (in dollars) and total cost (in dollars) from the production and sale of different units of a product. Price Quantity Total Cost Total Marginal Marginal Marginal Profit Revenue Revenue Cost Profit 15 14 N 13 12 12 4 18 11 5 25 10 6 33 Use Excel to complete the table by computing: the total revenue at each level of output, marginal revenue, marginal cost, and marginal profit. What is the profit-maximizing level of output for the firm ? Based on the above table, how does an increase in price affect the quantity of output sold by the firm
Step by Step Solution
There are 3 Steps involved in it
1 Expert Approved Answer
Step: 1 Unlock

Question Has Been Solved by an Expert!
Get step-by-step solutions from verified subject matter experts
Step: 2 Unlock
Step: 3 Unlock