

Question: In the long runr if the rm decides to keep output at its initial level, what will it likely do? 0 Shut down C) Shift
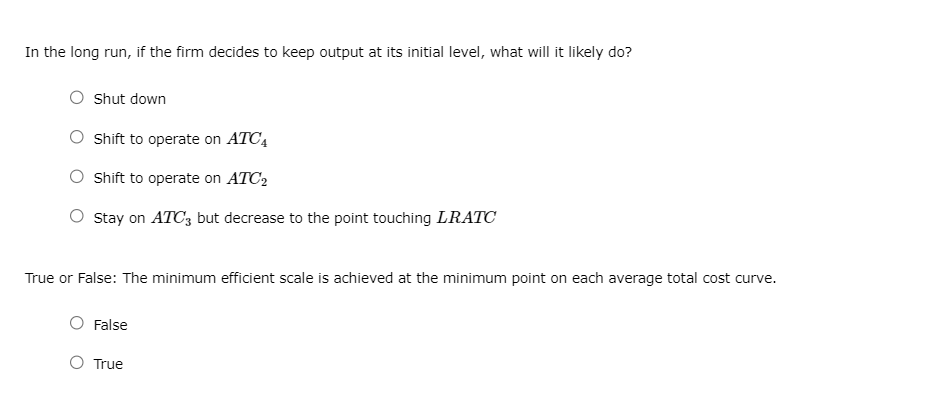
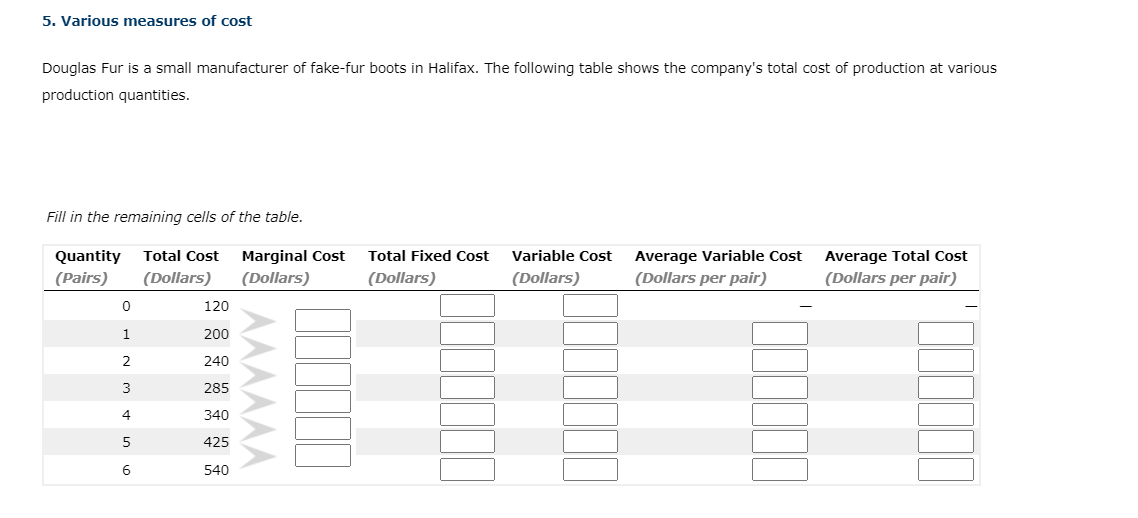
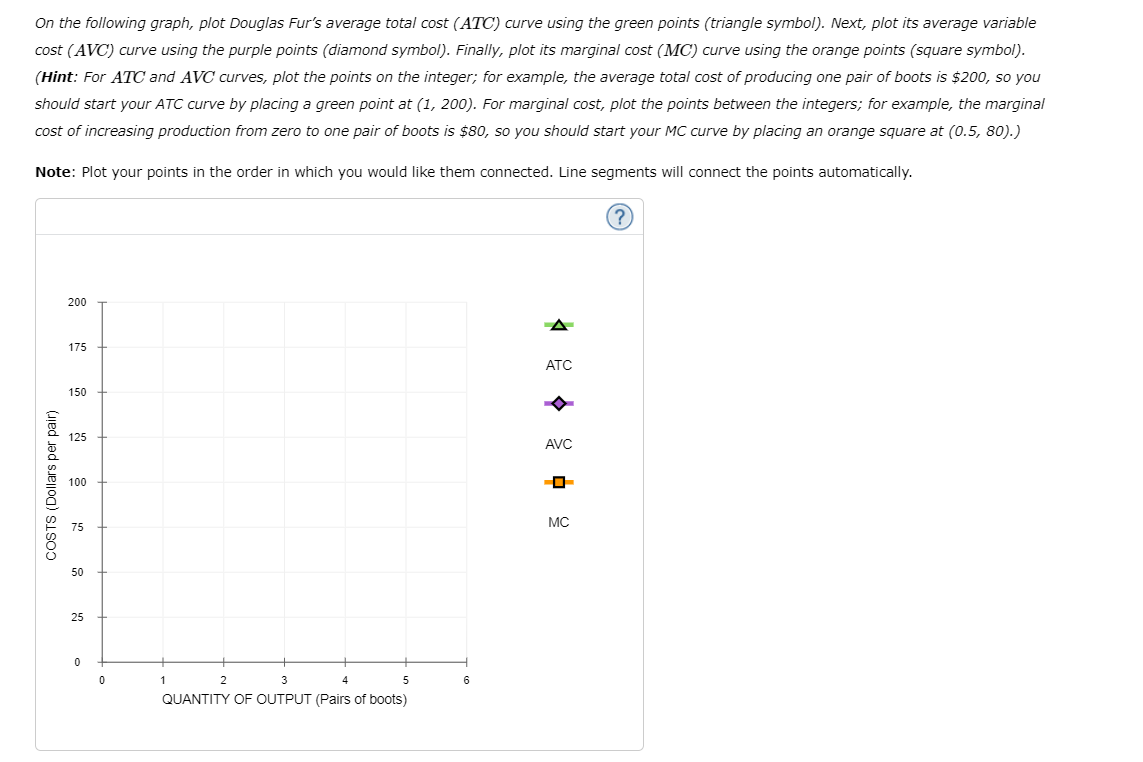
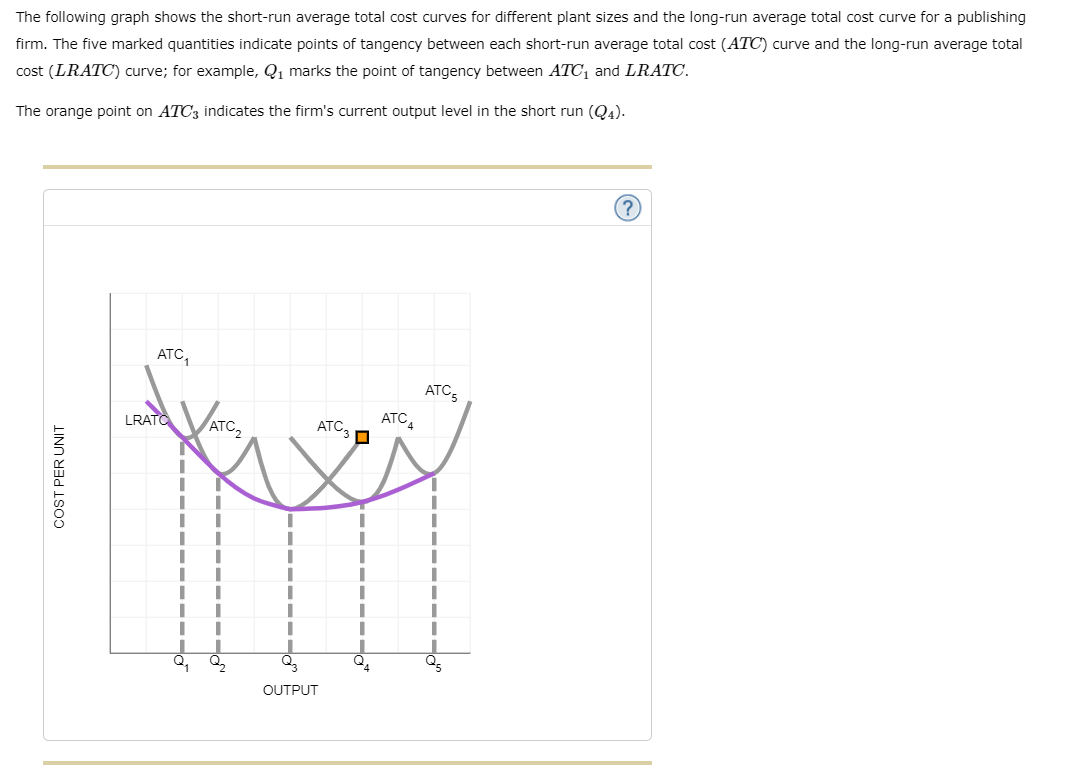
In the long runr if the rm decides to keep output at its initial level, what will it likely do? 0 Shut down C) Shift to operate on Aftf4 O Shift to operate on Am; C) Stan.l on AID; but decrease to the point touching LRATE' True or False: The minimum efficient scale is achieved at the minimum point on each average total cost curve. 0 False 0 True 5. Various measures of cost Douglas Fur is a small manufacturer of fake-fur boots in Halifax. The following table shows the company's total cost of production at various production quantities. Fill in the remaining cells of the table. Quantity Total Cost Marginal Cost Total Fixed Cost Variable Cost Average Variable Cost Average Total Cost (Pairs) (Dollars) (Dollars) (Dollars) (Dollars) (Dollars per pair) (Dollars per pair) 0 120 200 2 240 3 285 4 340 5 425 6 540On the following graph, plot Douglas Fur's average total cost (ATO) curve using the green points (triangle symbol). Next, plot its average variable cost (AVG) curve using the purple points (diamond symbol). Finally, plot its marginal cost (MC) curve using the orange points (square symbol). (Hint: For ATC' ancl AVC curves, plot the points on the integer; for example, the average total cost of producing one pair of boots is $200, so you should start your ATC curve by placing a green point at (I, 200). For marginal cost, plot the points between the integers; for example, the marginal cost of increasing production from zero to one pair of boots is $80, so you should start your MC curve by placing an orange square at (0. 5, 80). ) Note: Plot your points in the order in which you would like them connected. Line segments will connect the points automatically. 200 A 1?5 -- ATC 150 -- 'C\" '8 125 -- 5 AVG C}. e 2 mo -- -I- C) Q E 75 MC 0'3 0 O m a I I 25 0 1 l l l l D 1 2 3 4 5 6 QUANTITY OF OUTPUT (Pairs of boots) The following graph shows the shortrun average total cost curves for different plant sizes and the longrun average total cost curve for a publishing firm. The five marked quantities indicate points of tangency;r between each shortan average total cost (AID) curve and the longrun average total cost (LRAIU) curve; for example, Q1 marks the point of tangency between AIUI and 15122110. The orange point on A3133 indicates the firm's current output level in the short run (Q4). (9 LRA COST PER UNIT D.___________ MO---- wE) OUTPUT
Step by Step Solution
There are 3 Steps involved in it

Get step-by-step solutions from verified subject matter experts