

Question: hurry please! $ MC ATC D AVC B . A 0 Refer to the above graph. At which point does average product (AP) hit a
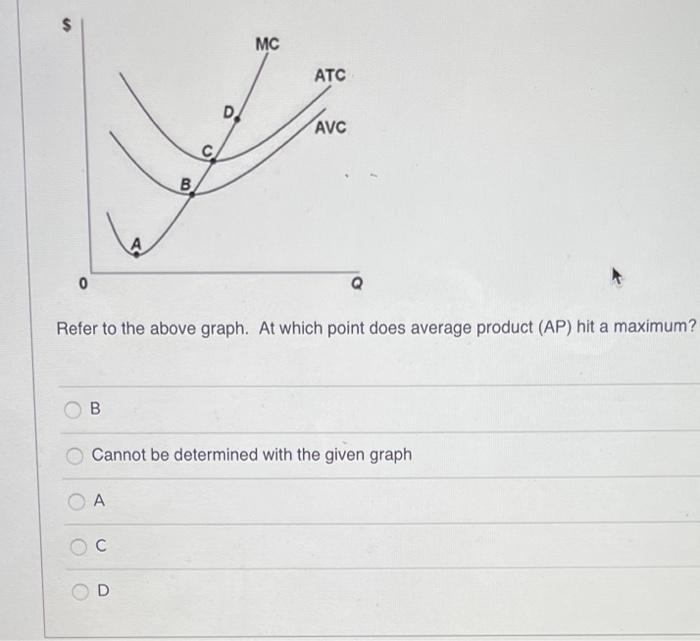
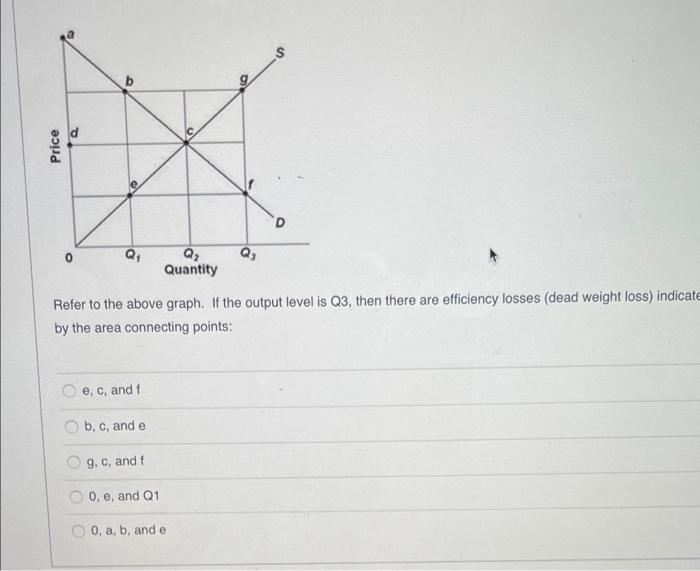
$ MC ATC D AVC B . A 0 Refer to the above graph. At which point does average product (AP) hit a maximum? B Cannot be determined with the given graph A D a CA b b d Price D Q Q Quantity Refer to the above graph. If the output level is Q3, then there are efficiency losses (dead weight loss) indicate by the area connecting points: e, c, and 1 b, c, and e 9, C, and 0, e, and 01 0, a, b, and e $ MC ATC D AVC B . A 0 Refer to the above graph. At which point does average product (AP) hit a maximum? B Cannot be determined with the given graph A D a CA b b d Price D Q Q Quantity Refer to the above graph. If the output level is Q3, then there are efficiency losses (dead weight loss) indicate by the area connecting points: e, c, and 1 b, c, and e 9, C, and 0, e, and 01 0, a, b, and e
Step by Step Solution
There are 3 Steps involved in it

Get step-by-step solutions from verified subject matter experts