

Question: HW Score: 0%, 0 . Data Table 2015 Variline, Inc. Comparative Income Statement Years Ended December 31, 2017 and 2016 Dollars in thousands 2017 2016
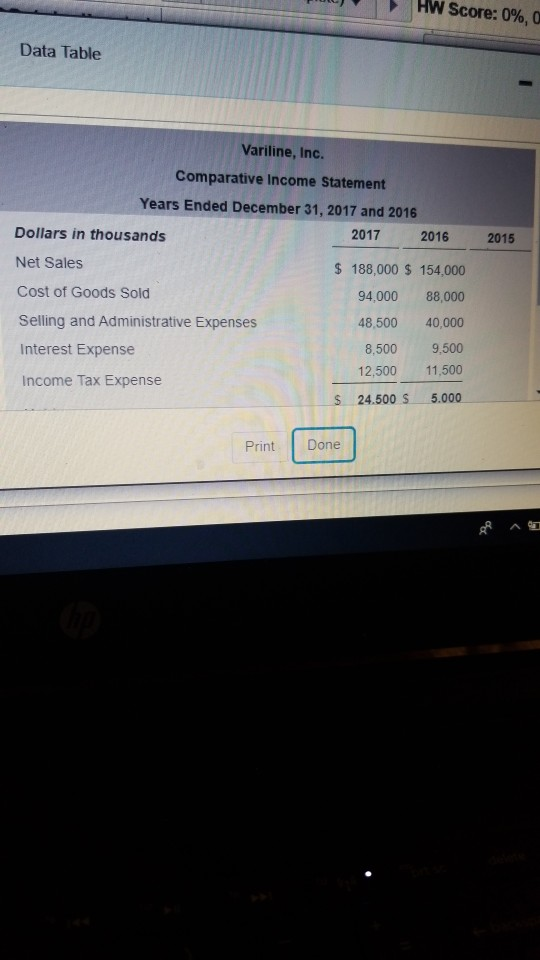
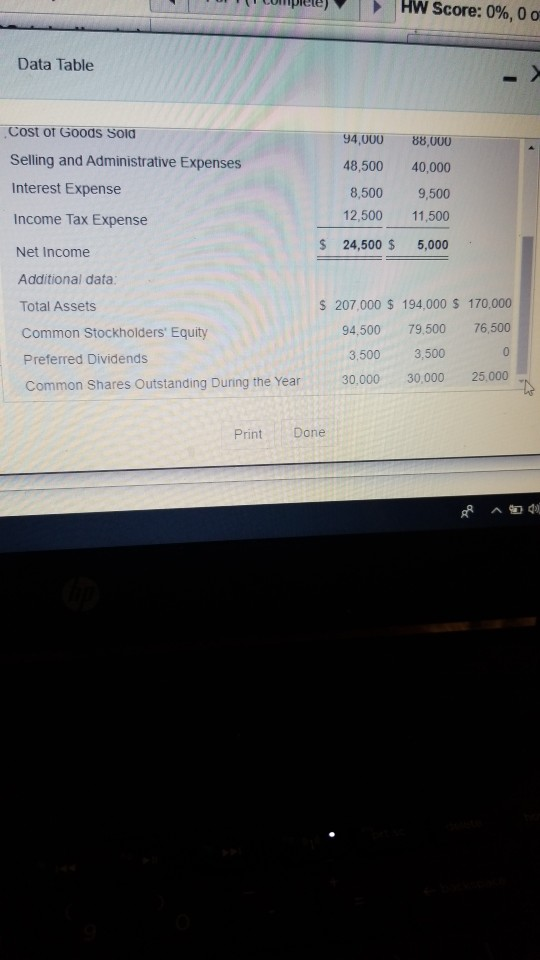
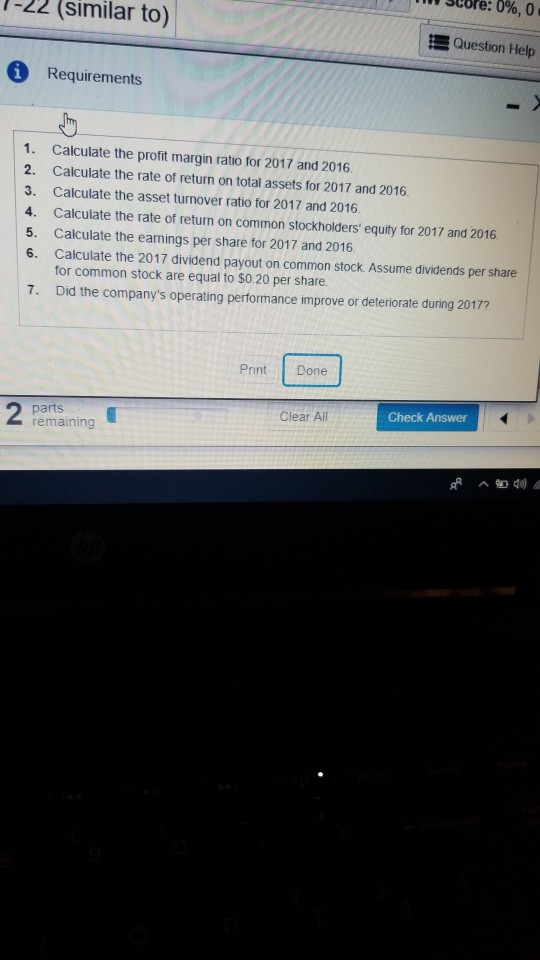
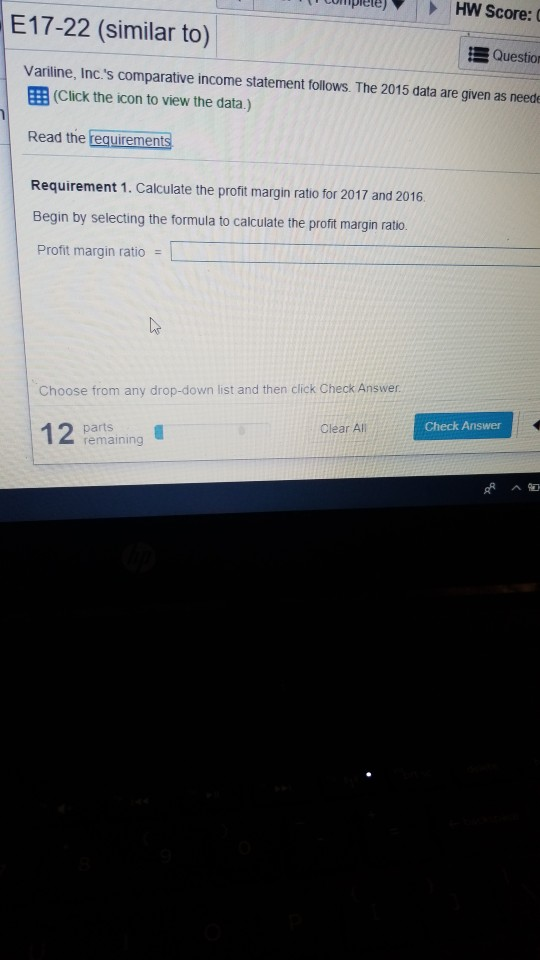
HW Score: 0%, 0 . Data Table 2015 Variline, Inc. Comparative Income Statement Years Ended December 31, 2017 and 2016 Dollars in thousands 2017 2016 Net Sales $ 188,000 $ 154,000 Cost of Goods Sold 94.000 88,000 Selling and Administrative Expenses 48,500 40,000 Interest Expense 8,500 9.500 12,500 11,500 Income Tax Expense $ 24.500 $ 5.000 Print Done 1-22 (similar to) Core: 0%, 0 Question Help A Requirements 1. Calculate the profit margin ratio for 2017 and 2016 2. Calculate the rate of return on total assets for 2017 and 2016 3. Calculate the asset turnover ratio for 2017 and 2016 Calculate the rate of return on common stockholders' equity for 2017 and 2016 5. Calculate the earnings per share for 2017 and 2016, 6. Calculate the 2017 dividend payout on common stock. Assume dividends per share for common stock are equal to $0.20 per share. 7. Did the company's operating performance improve or deteriorate during 2017? Print Done 2 parts remaining Clear All Check Answer Lumele) HW Score: E17-22 (similar to) B Questio Variline, Inc.'s comparative income statement follows. The 2015 data are given as neede (Click the icon to view the data.) Read the requirements Requirement 1. Calculate the profit margin ratio for 2017 and 2016. Begin by selecting the formula to calculate the profit margin ratio. Profit margin ratio = Choose from any drop-down list and then click Check Answer Check Answer 12 parts Clear All 12 remaining
Step by Step Solution
There are 3 Steps involved in it

Get step-by-step solutions from verified subject matter experts