

Question: HW2_7 Write a MATLAB function that plots a line segment & its midpoint. The function should take as input m & b (for the
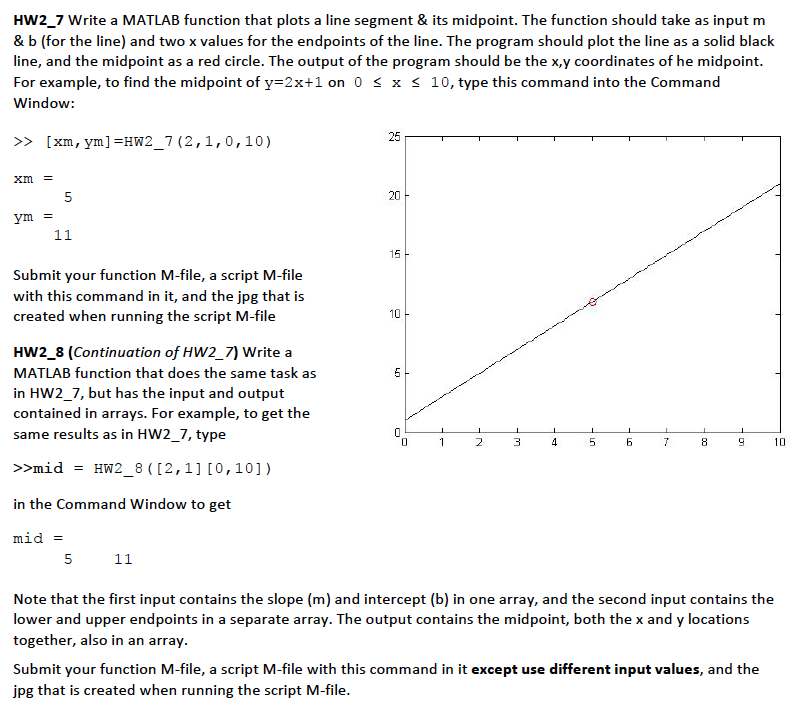
HW2_7 Write a MATLAB function that plots a line segment & its midpoint. The function should take as input m & b (for the line) and two x values for the endpoints of the line. The program should plot the line as a solid black line, and the midpoint as a red circle. The output of the program should be the x,y coordinates of he midpoint. For example, to find the midpoint of y=2x+1 on 0 x 10, type this command into the Command Window: >> [xm, ym] =HW2_7 (2,1,0,10) xm = ym = 5 11 Submit your function M-file, a script M-file with this command in it, and the jpg that is created when running the script M-file HW2_8 (Continuation of HW2_7) Write a MATLAB function that does the same task as in HW2_7, but has the input and output contained in arrays. For example, to get the same results as in HW2_7, type >>mid = HW2_8 ([2,1] [0,10]) in the Command Window to get mid = 5 11 25 20 15 10 40 0 0 1 1 1 NI 2 I 3 L 4 - 5 L 6 7 00 8 9 10 Note that the first input contains the slope (m) and intercept (b) in one array, and the second input contains the lower and upper endpoints in a separate array. The output contains the midpoint, both the x and y locations together, also in an array. Submit your function M-file, a script M-file with this command in it except use different input values, and the jpg that is created when running the script M-file.
Step by Step Solution
There are 3 Steps involved in it
The question appears to be a multipart homework assignment involving MATLAB programming It requires writing a MATLAB function to plot a line segment g... View full answer

Get step-by-step solutions from verified subject matter experts