

Question: From the experimental data set provided below(at 26.7C and latm) of shear stress T (lbs/ft) and rate of deformation or du/dy(1/s or s) of
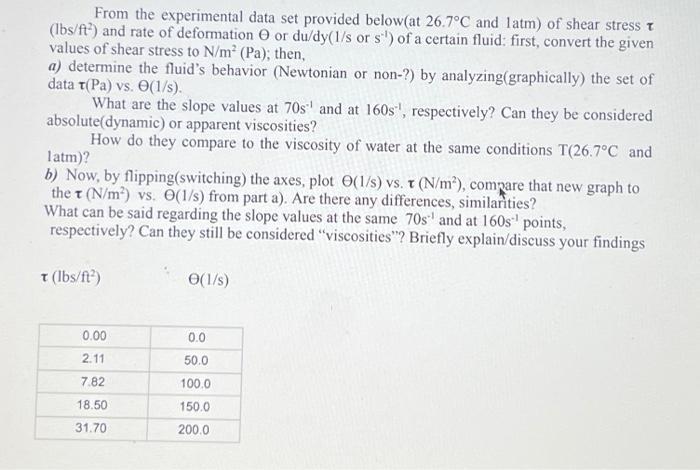
From the experimental data set provided below(at 26.7C and latm) of shear stress T (lbs/ft) and rate of deformation or du/dy(1/s or s) of a certain fluid: first, convert the given values of shear stress to N/m (Pa); then, a) determine the fluid's behavior (Newtonian or non-?) by analyzing(graphically) the set of data t(Pa) vs. (1/s). What are the slope values at 70s and at 160s, respectively? Can they be considered absolute(dynamic) or apparent viscosities? How do they compare to the viscosity of water at the same conditions T(26.7C and latm)? b) Now, by flipping(switching) the axes, plot (1/s) vs. T (N/m), compare that new graph to the t (N/m) vs. O(1/s) from part a). Are there any differences, similarities? What can be said regarding the slope values at the same 70s and at 160s points, respectively? Can they still be considered "viscosities"? Briefly explain/discuss your findings t (lbs/ft) 0.00 2.11 7.82 18.50 31.70 (1/s) 0.0 50.0 100.0 150.0 200.0
Step by Step Solution
3.36 Rating (152 Votes )
There are 3 Steps involved in it
The provided image presents information about a laboratory experiment designed to study the rheological properties of a fluid To perform the analysis ... View full answer

Get step-by-step solutions from verified subject matter experts