

Question: Hypothesis testing about a population variance 4. Hypothesis testing about Summary statistics for the first-round games In the five National Collegiate Athletic Association (NCAA) basketball
Hypothesis testing about a population variance
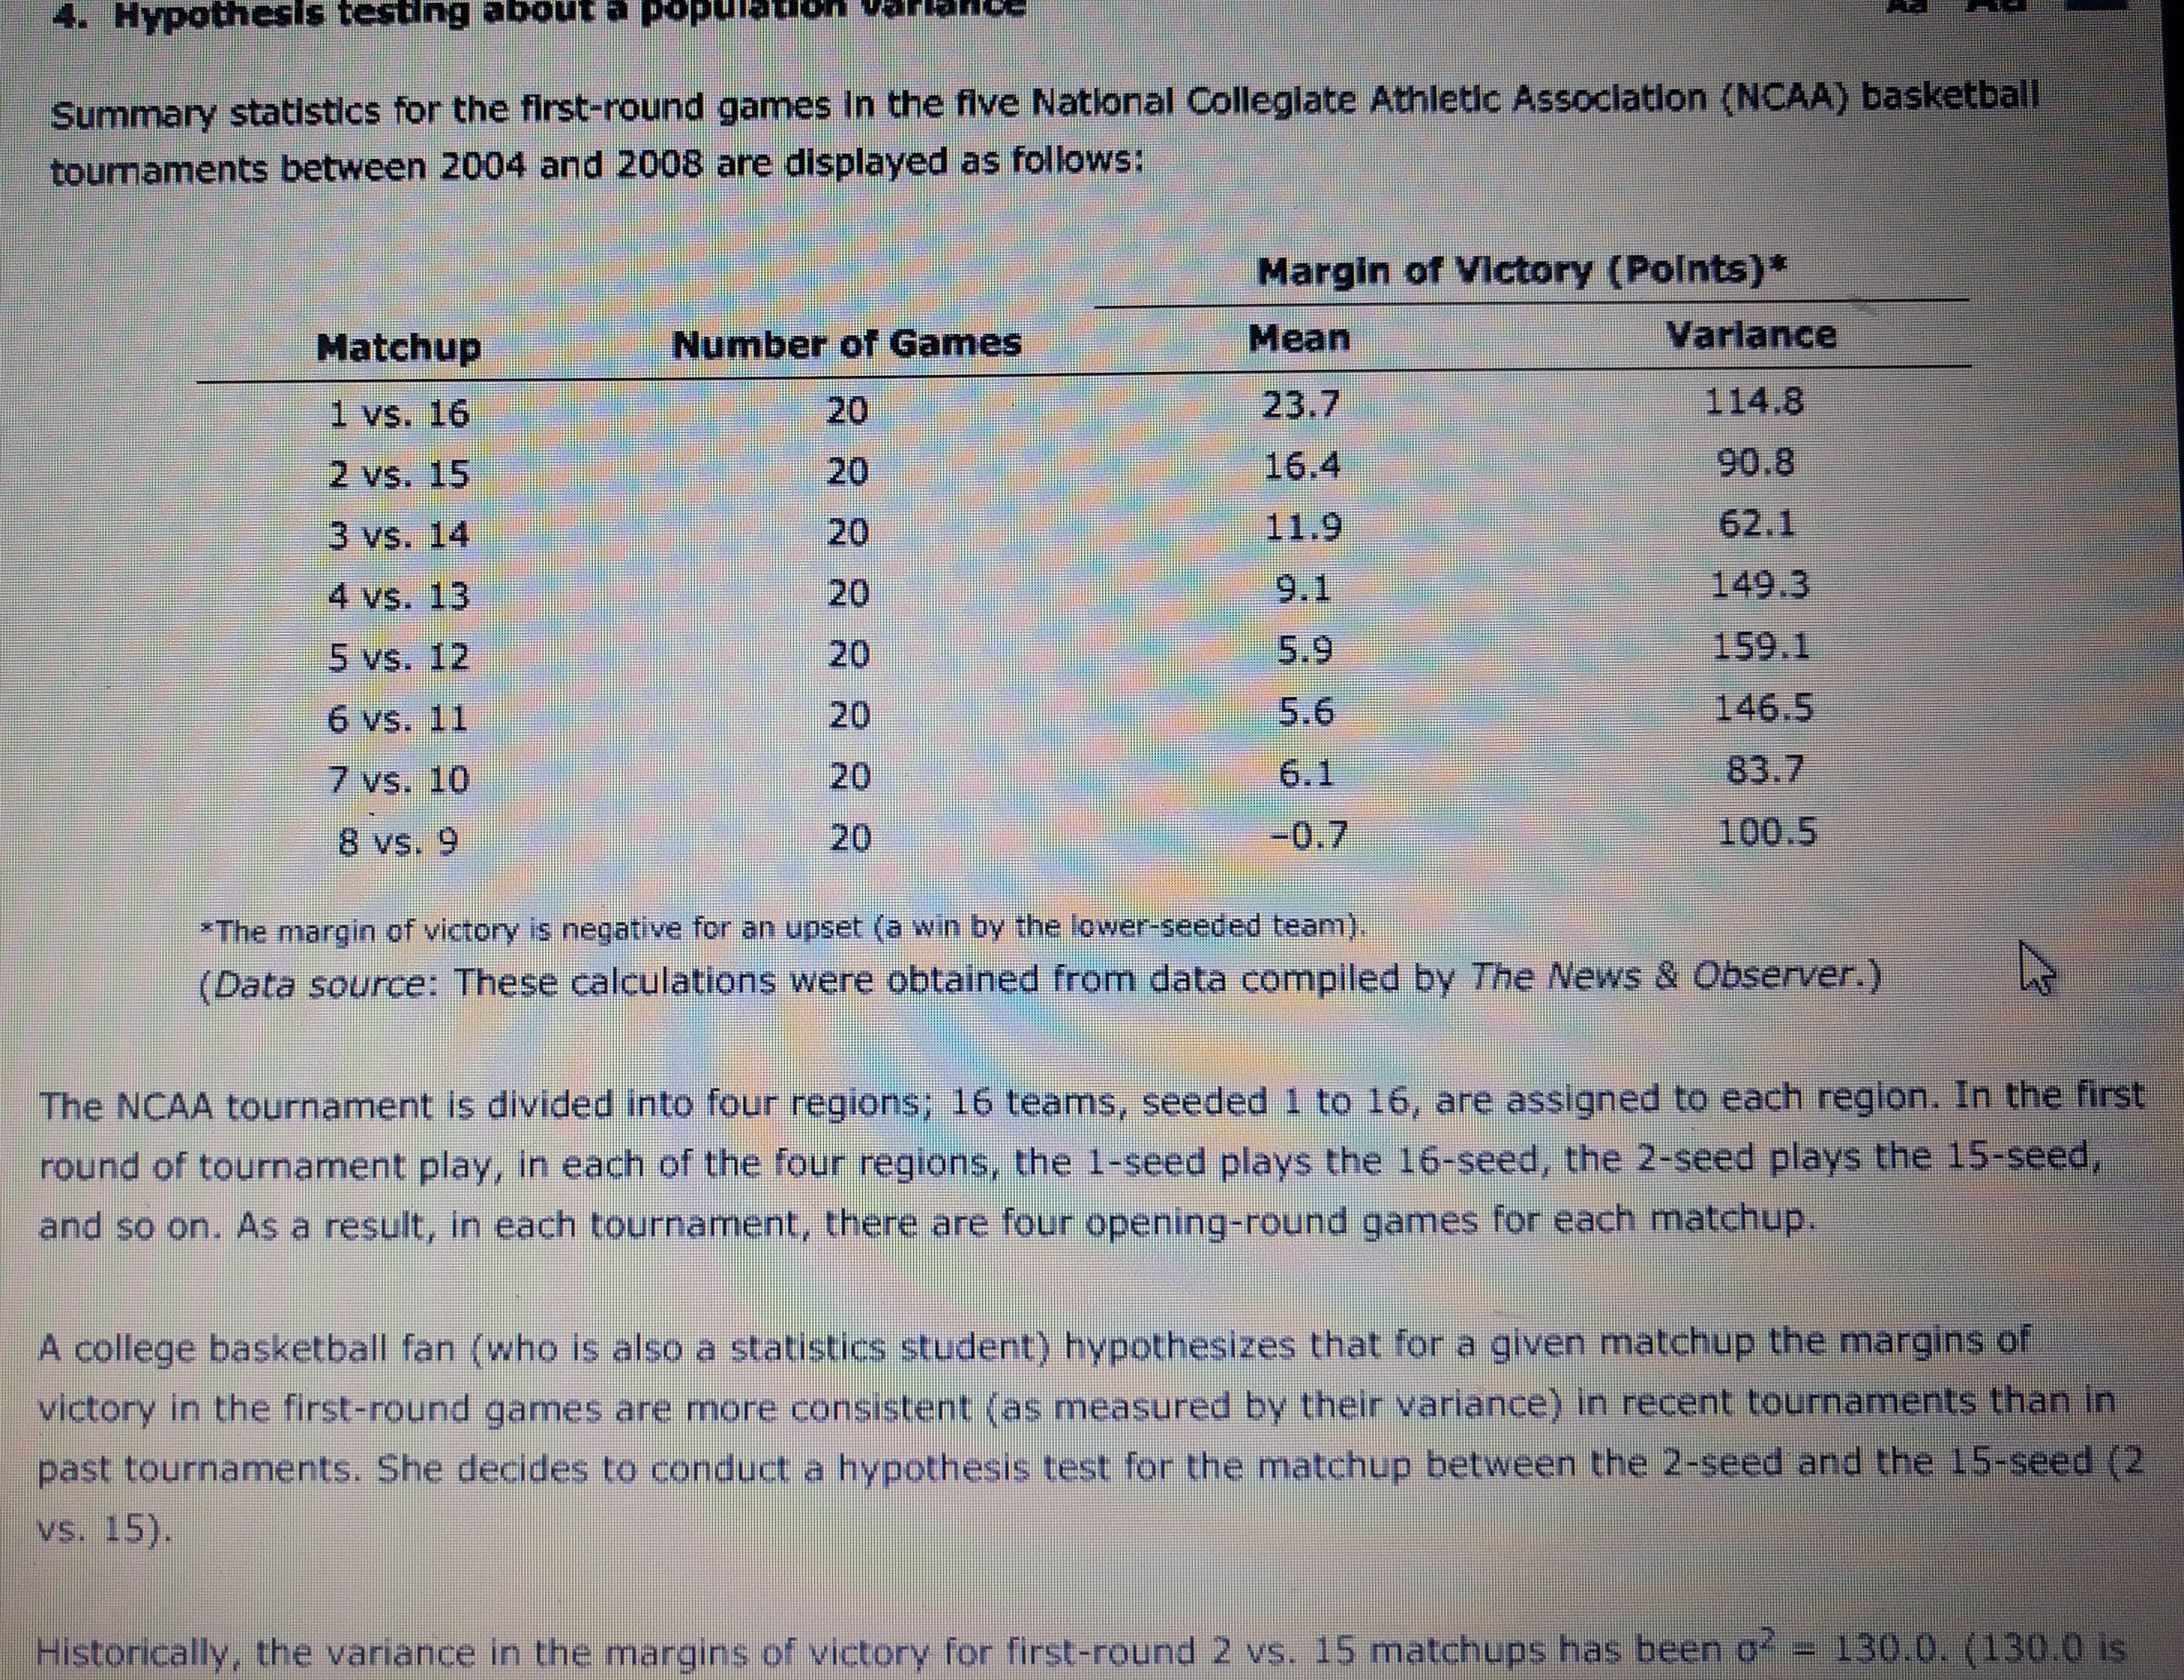
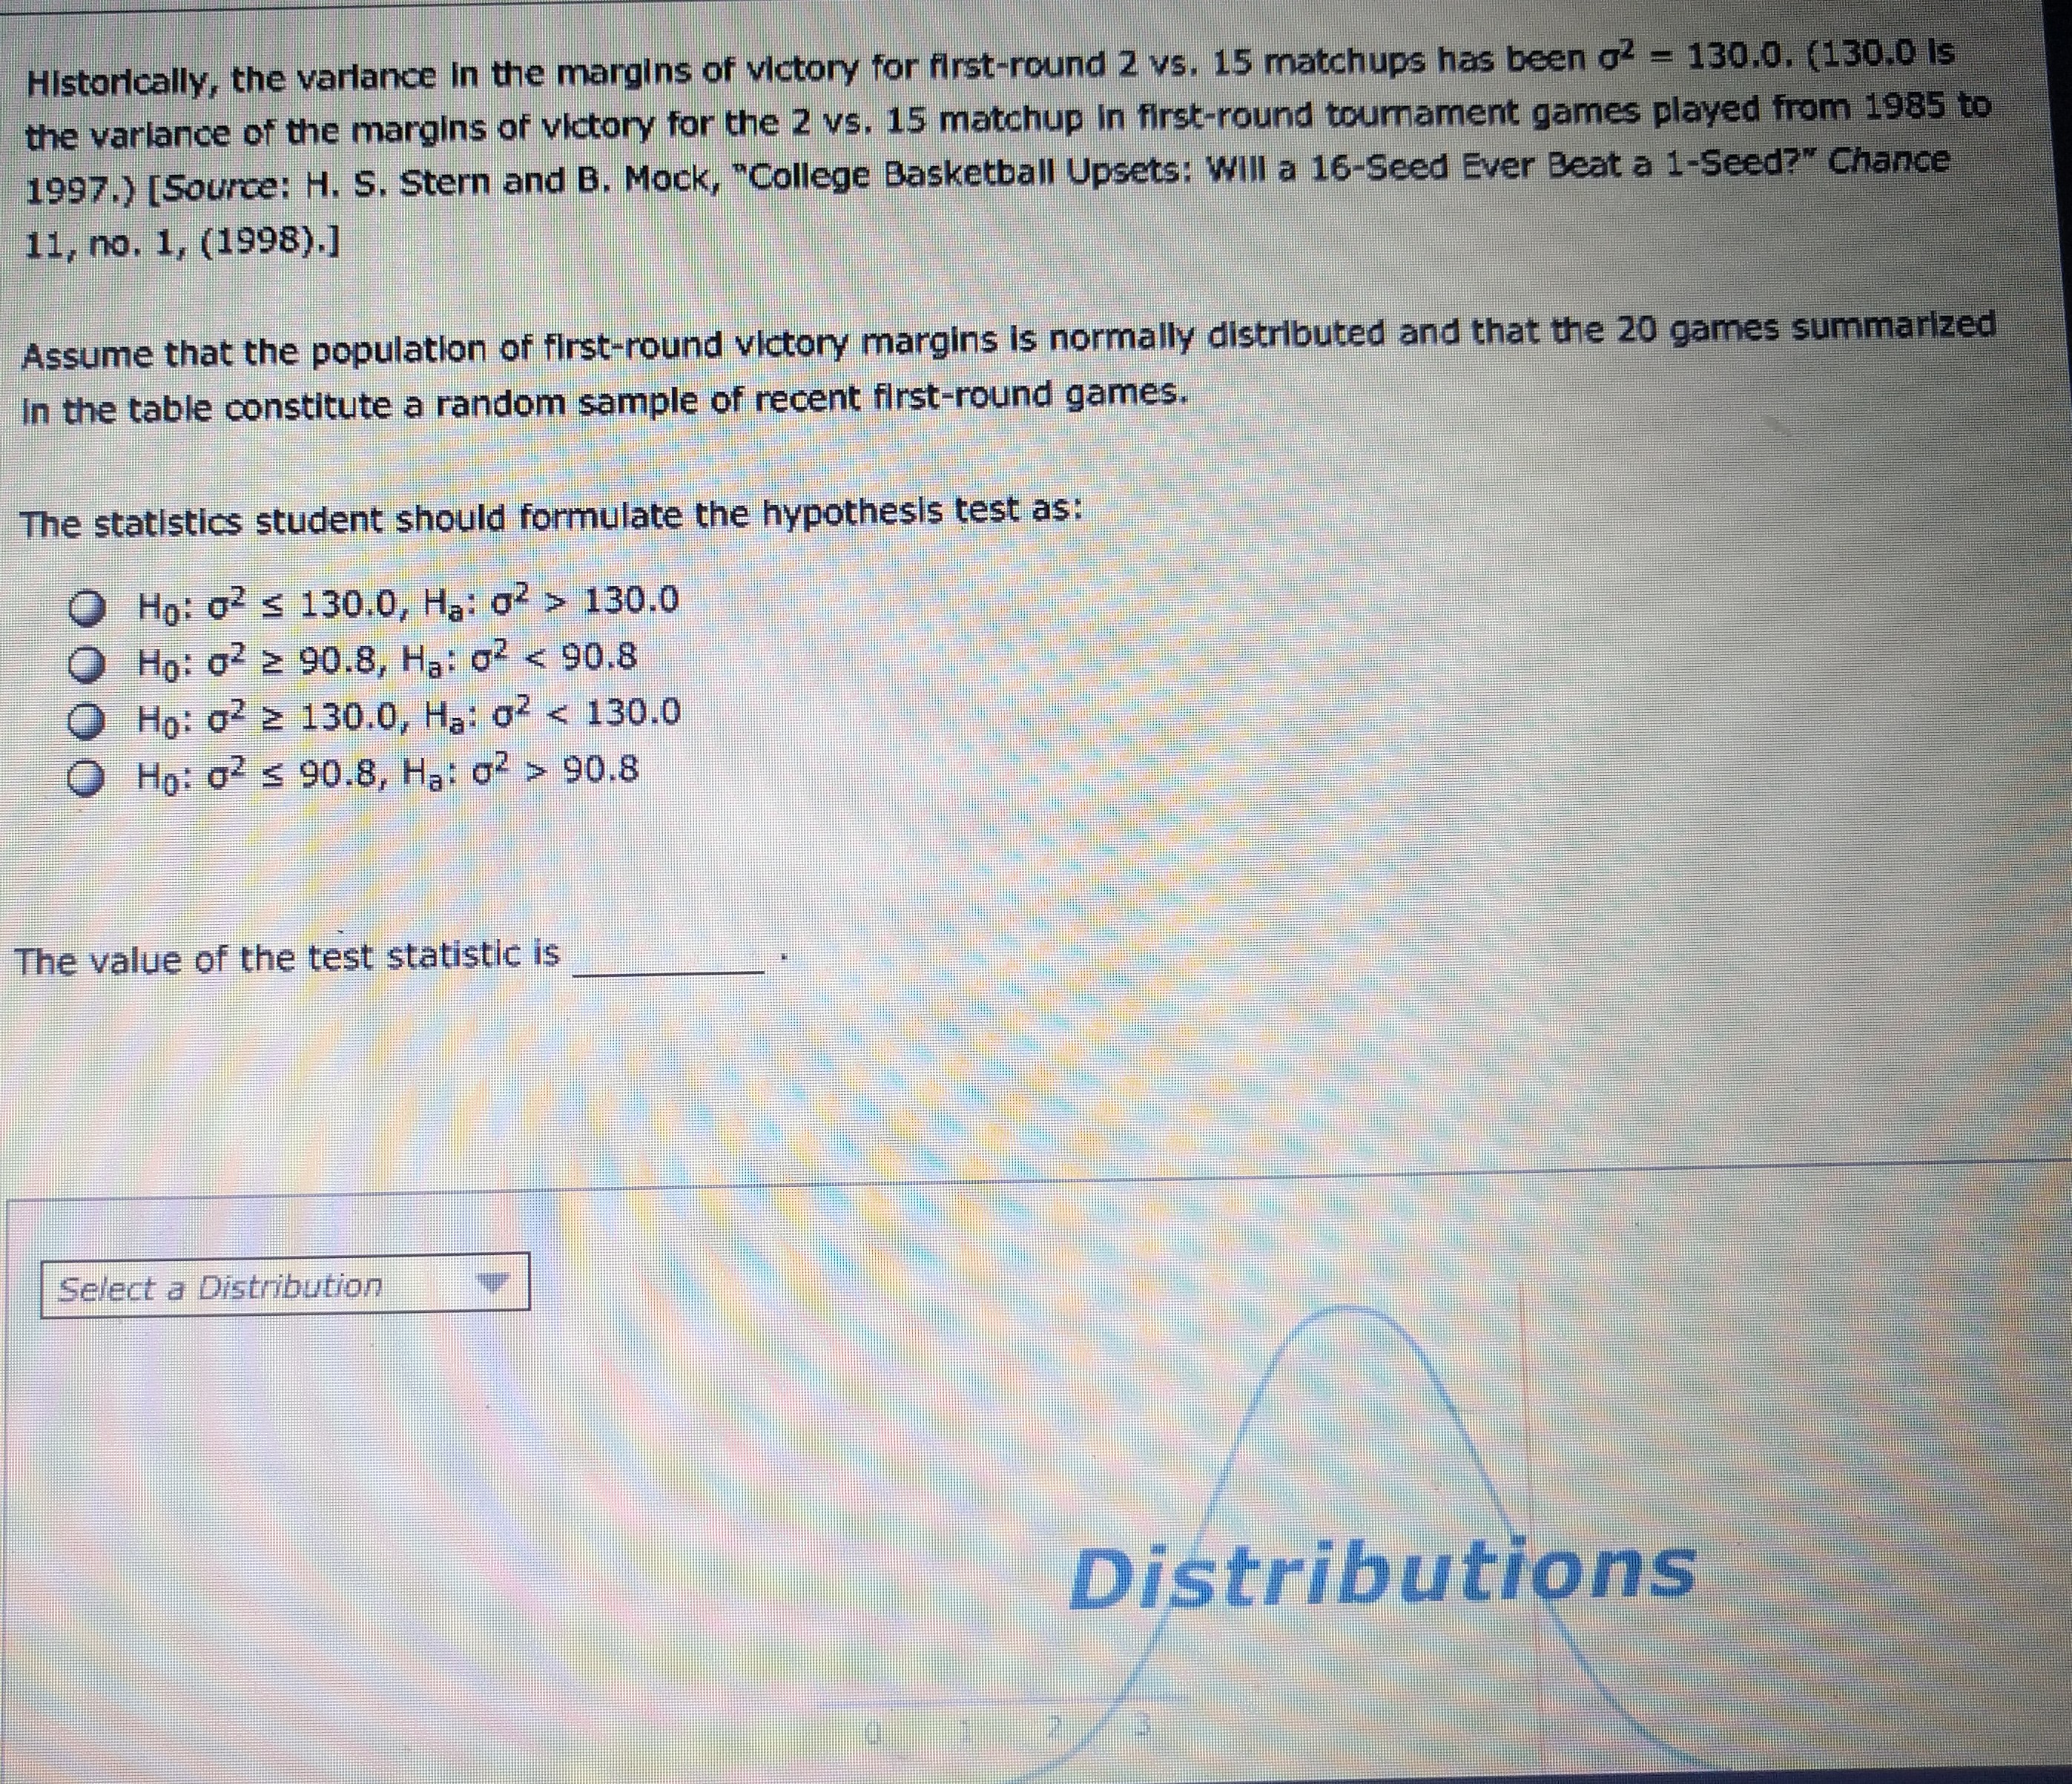
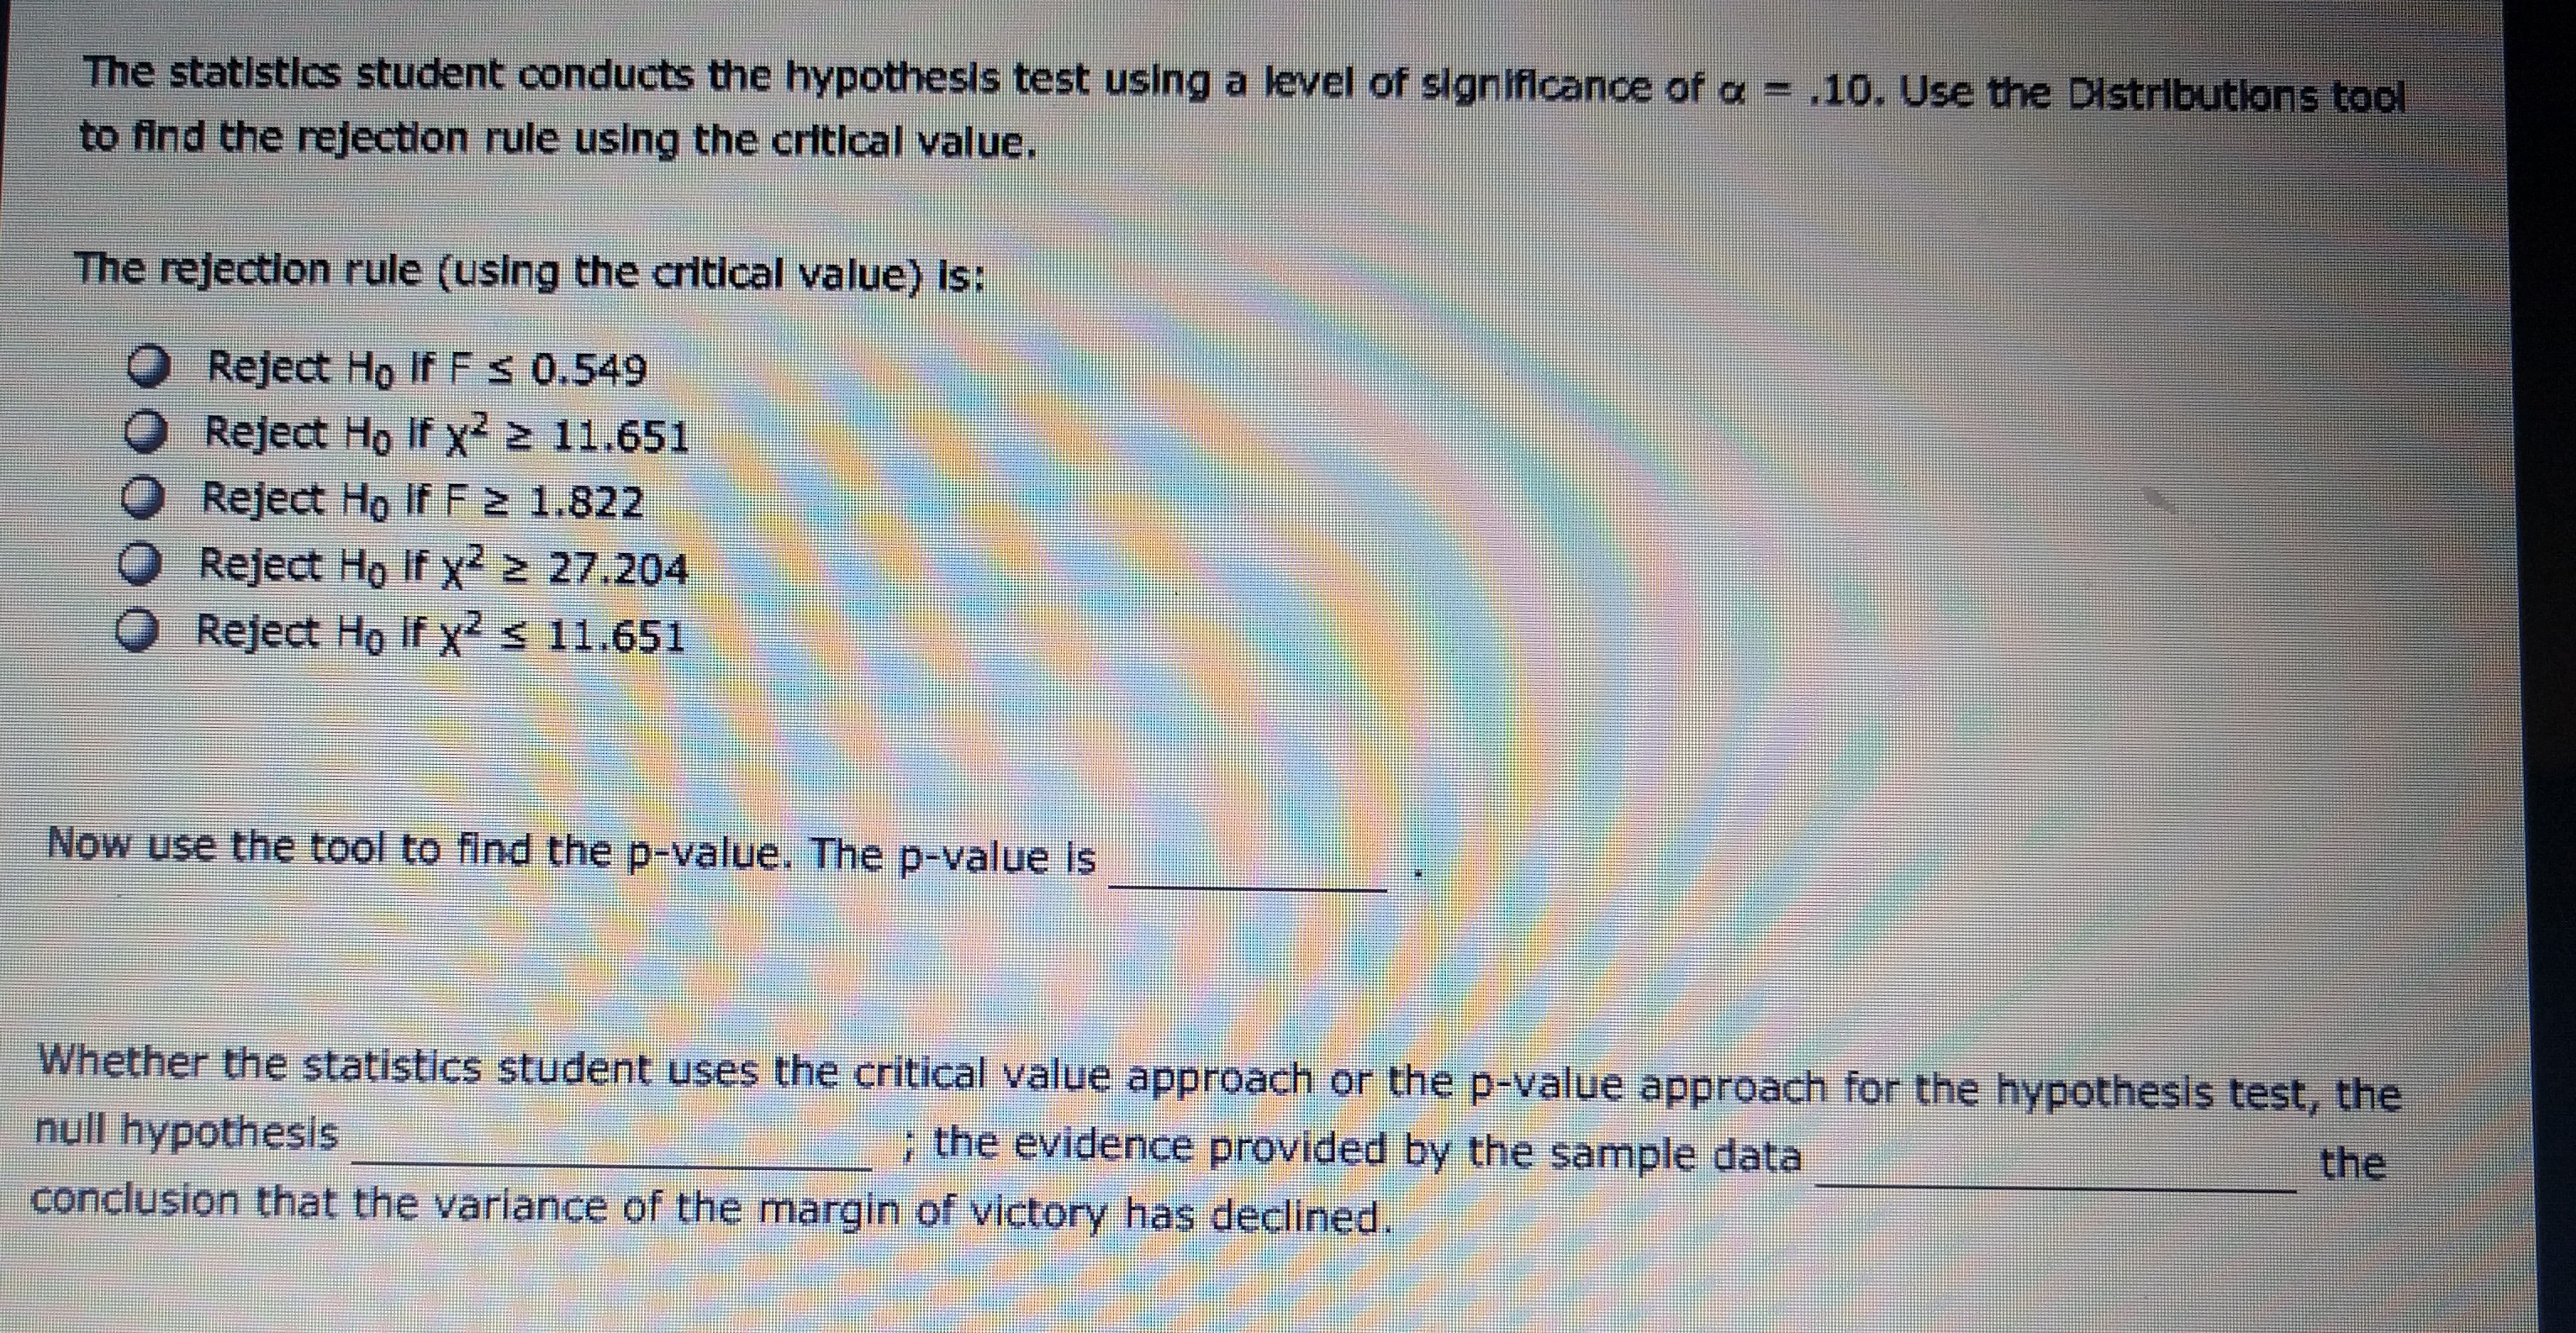
4. Hypothesis testing about Summary statistics for the first-round games In the five National Collegiate Athletic Association (NCAA) basketball tournaments between 2004 and 2008 are displayed as follows: Margin of Victory (Points)* Matchup Number of Games Mean Variance 1 vs. 16 20 23.7 114.8 2 vs. 15 20 16.4 90.8 3 vs. 14 20 11.9 62.1 4 vs. 13 20 9 .1 149.3 5 vs. 12 20 5.9 159.1 6 vs. 11 20 5.6 146.5 7 vs. 10 20 6.1 83.7 8 vs. 9 20 -0.7 100.5 The margin of victory is negative for an upset (a win by the lower-seeded team). (Data source: These calculations were obtained from data compiled by The News & Observer.) The NCAA tournament is divided into four regions; 16 teams, seeded 1 to 16, are assigned to each region. In the first round of tournament play, in each of the four regions, the 1-seed plays the 16-seed, the 2-seed plays the 15-seed, and so on. As a result, in each tournament, there are four opening-round games for each matchup A college basketball fan (who is also a statistics student) hypothesizes that for a given matchup the margins of victory in the first-round games are more consistent (as measured by their variance) in recent tournaments than in past tournaments. She decides to conduct a hypothesis test for the matchup between the 2-seed and the 15-seed (2 vs. 15). Historically, the variance in the margins of victory for first-round 2 vs. 15 matchups has been of = 130.0. (130.0 isHistorically, the variance in the margins of victory for first-round 2 vs. 15 matchups has been o2 - 130.0. (130.0 Is the varlance of the margins of victory for the 2 vs. 15 matchup in first-round tournament games played from 1985 to 1997.) [Source: H. S. Stern and B. Mock, "College Basketball Upsets: Will a 16-Seed Ever Beat a 1-Seed?" Chance 11, no. 1, (1998).] Assume that the population of first-round victory margins is normally distributed and that the 20 games summarized In the table constitute a random sample of recent first-round games. The statistics student should formulate the hypothesis test as: Ho: 02 s 130.0, Ha: 02 > 130.0 O Ho: 02 2 90.8, Ha: 62 90.8 The value of the test statistic is Select a Distribution DistributionsThe statistics student conducts the hypothesis test using a level of significance of a = .10. Use the Distributions tool to find the rejection rule using the critical value. The rejection rule (using the critical value) Is: Reject Ho If F S 0.549 O Reject Ho If x2 2 11.651 O Reject Ho If F 2 1.822 Reject Ho If x2 2 27.204 Reject Ho If x2 s 11.651 Now use the tool to find the p-value. The p-value is Whether the statistics student uses the critical value approach or the p-value approach for the hypothesis test, the null hypothesis ; the evidence provided by the sample data the conclusion that the variance of the margin of victory has declined
Step by Step Solution
There are 3 Steps involved in it

Get step-by-step solutions from verified subject matter experts