

Question: Hypothesis testing about a population variance (p-value approach) 2. Hypothesis testing about a population variance (p-value approach) Summary statistics for the first-round games in the
Hypothesis testing about a population variance (p-value approach)
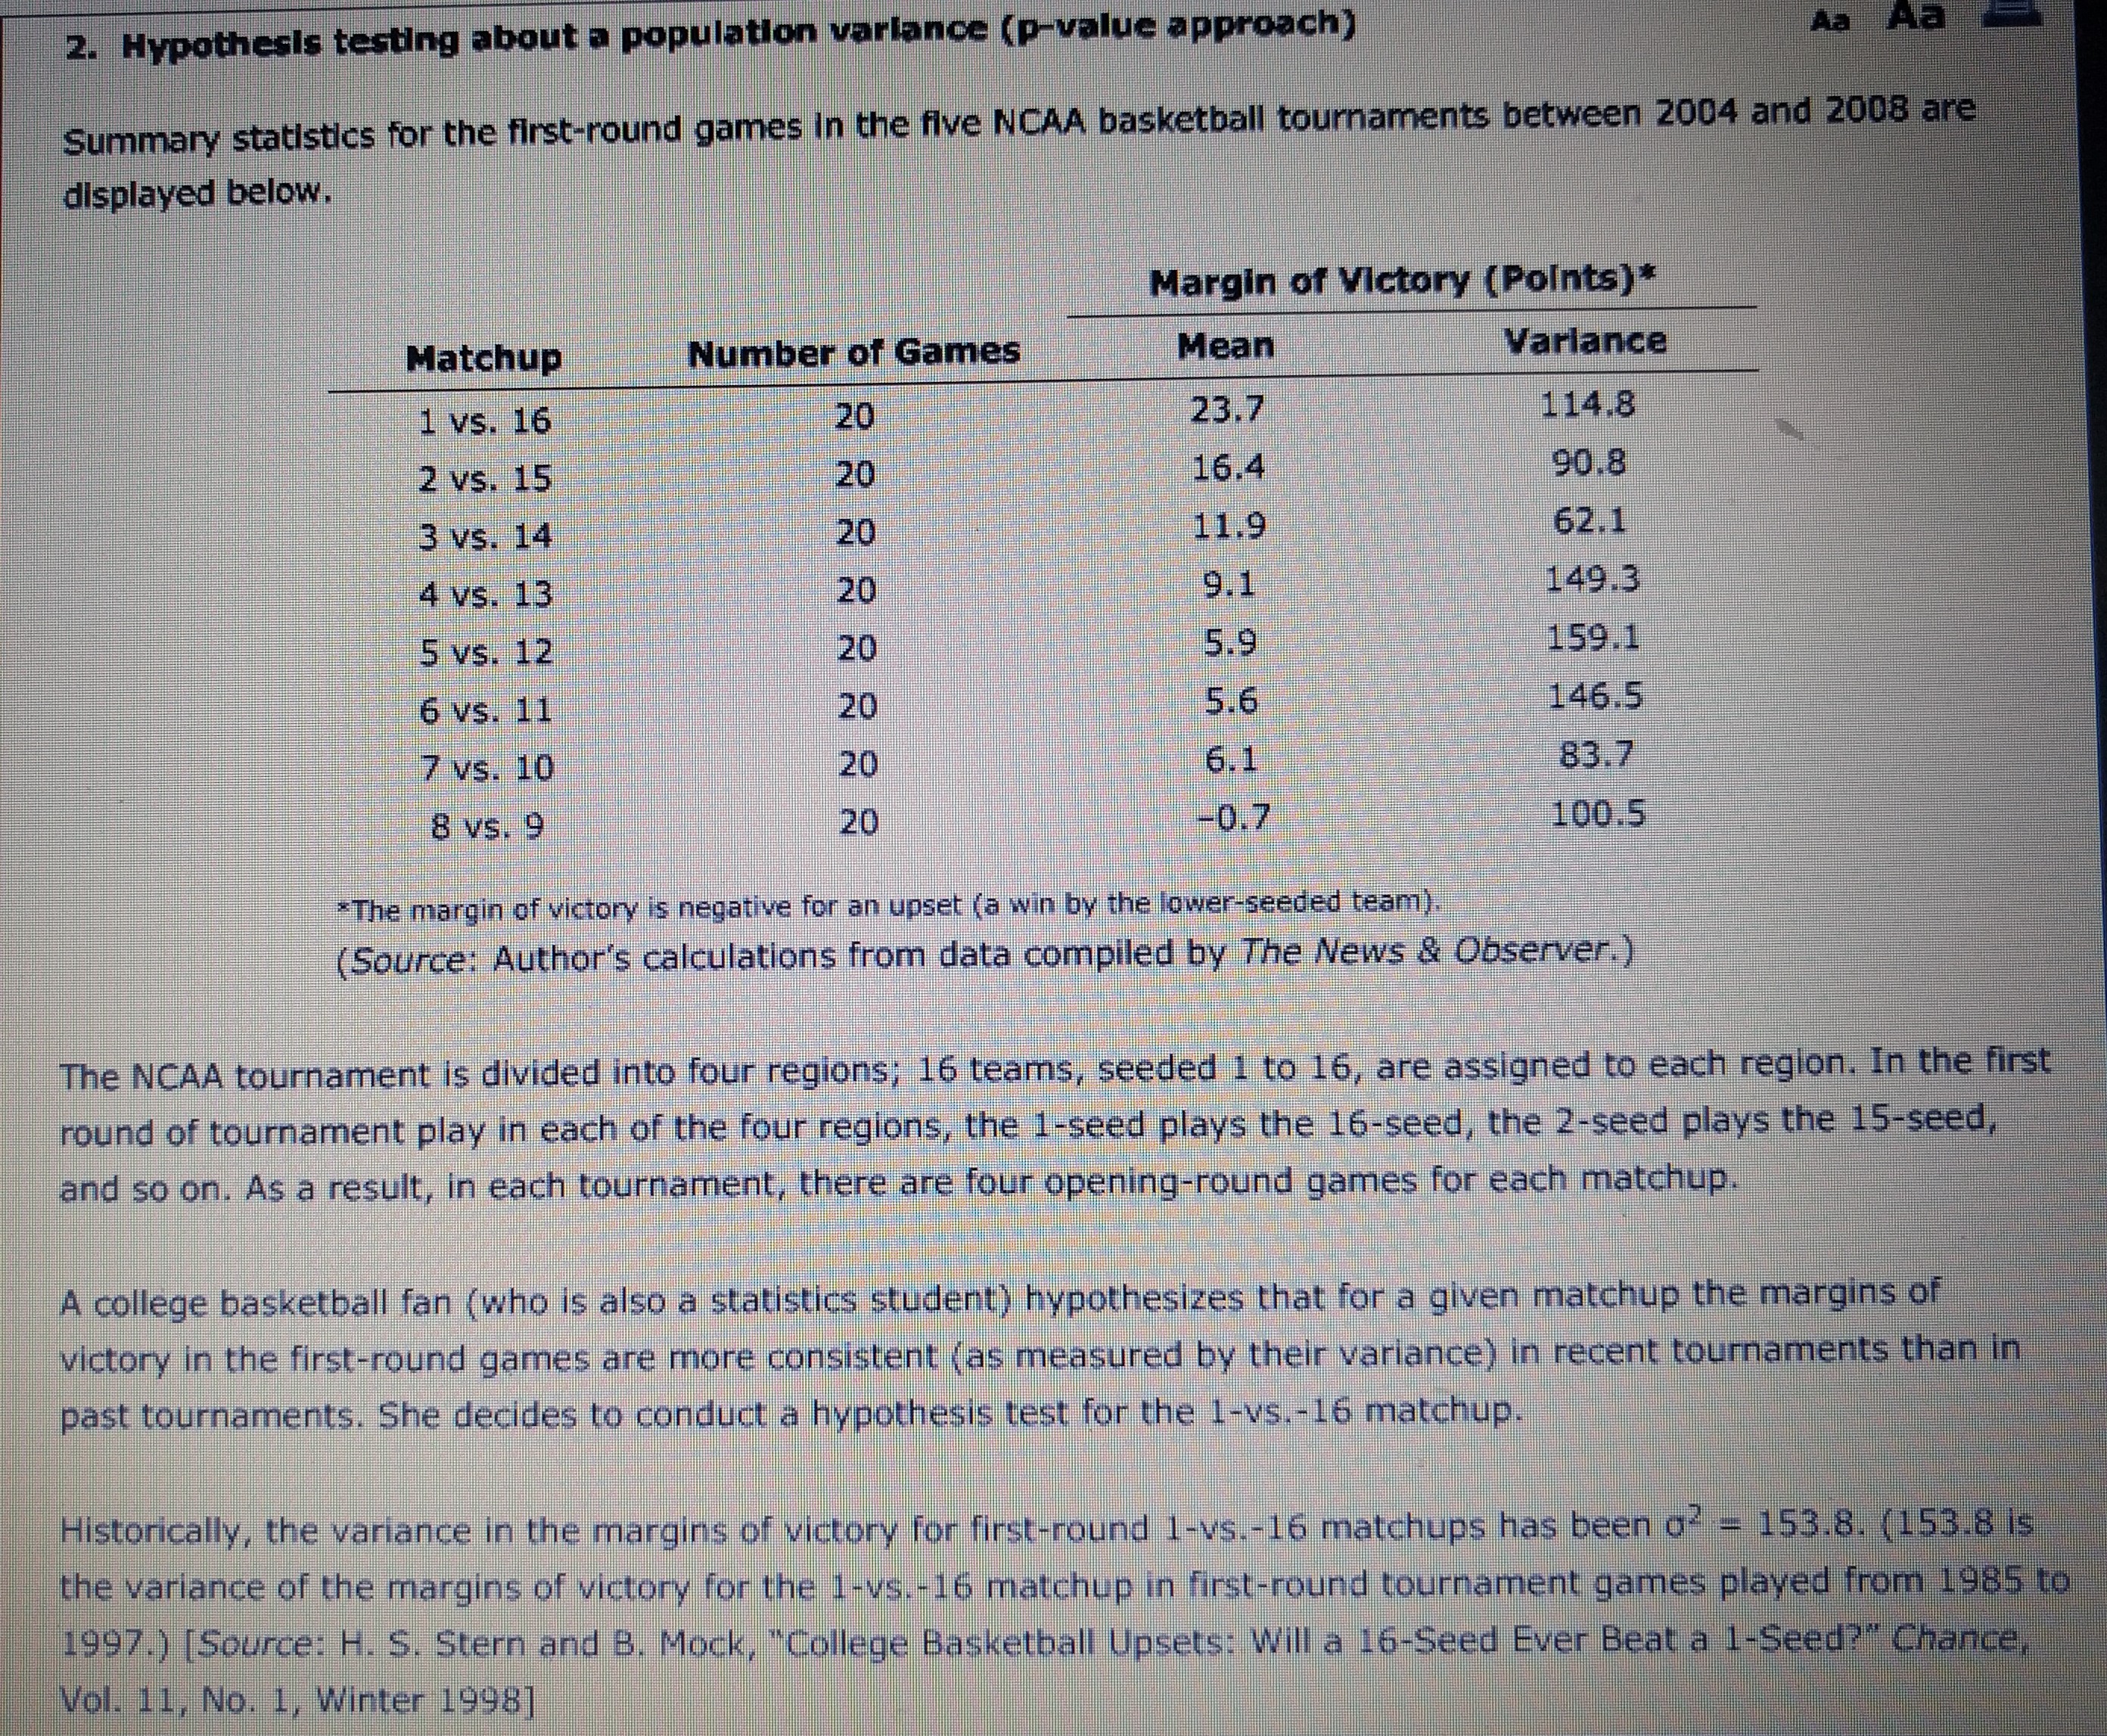
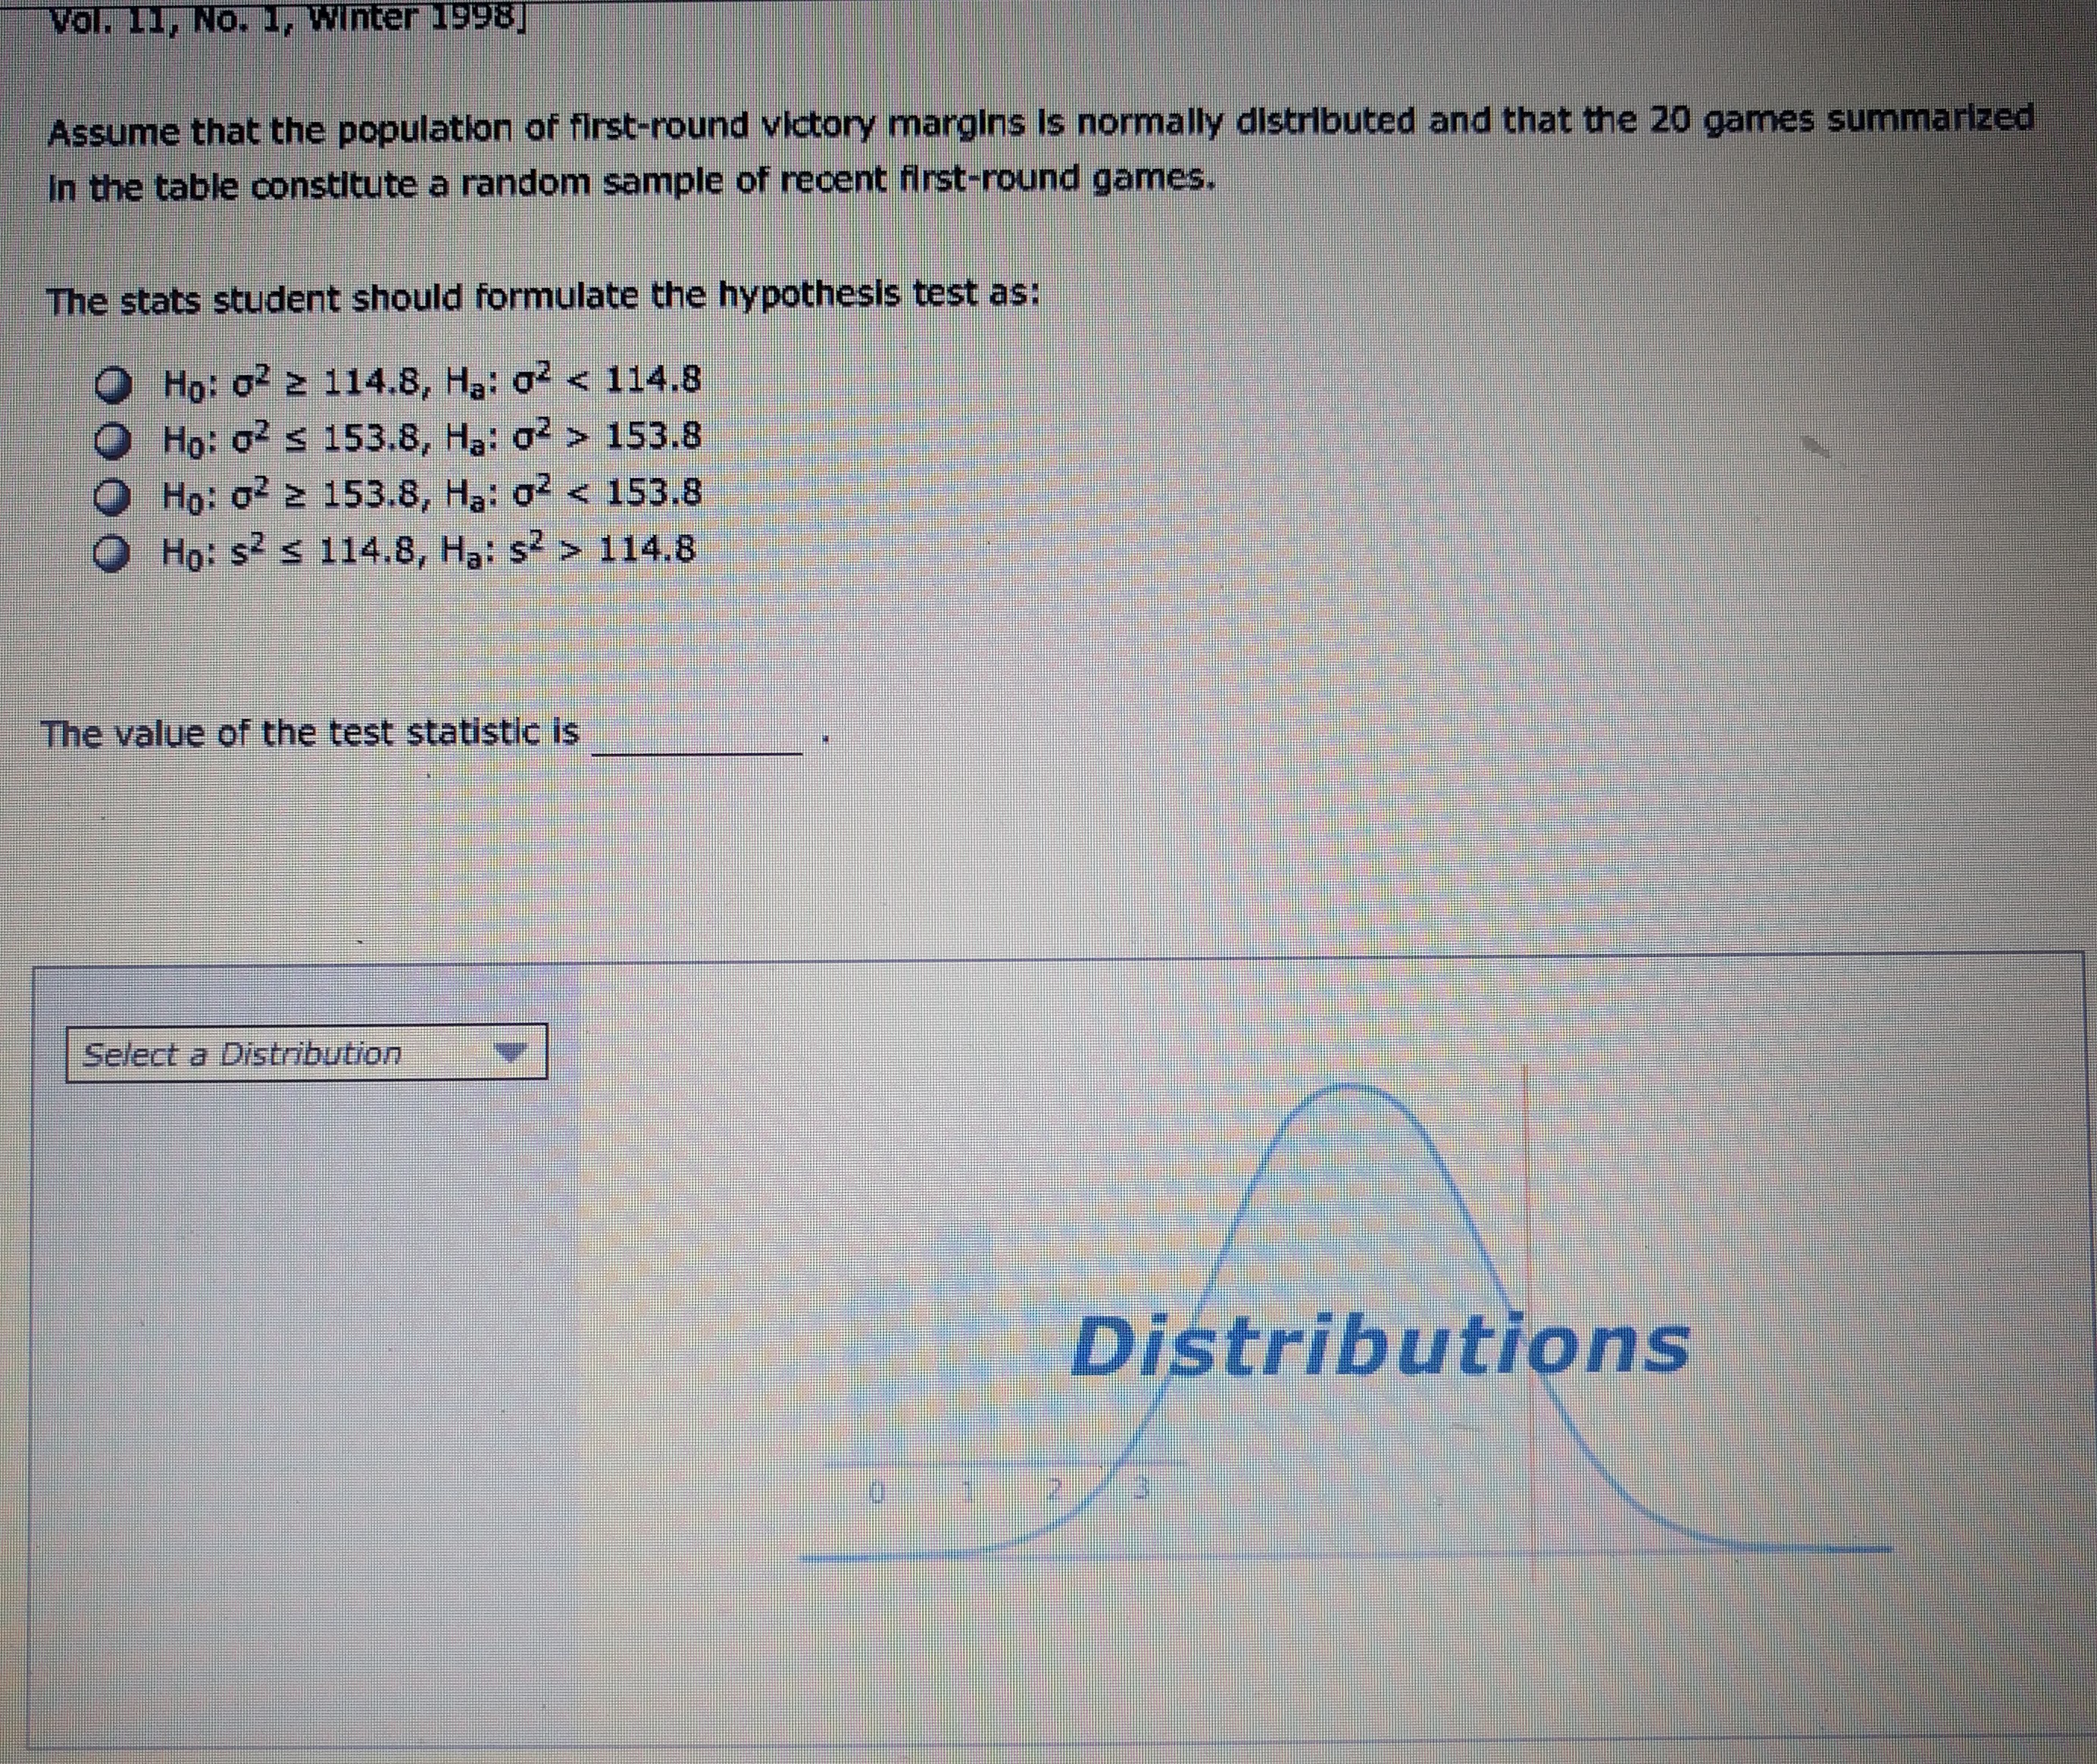
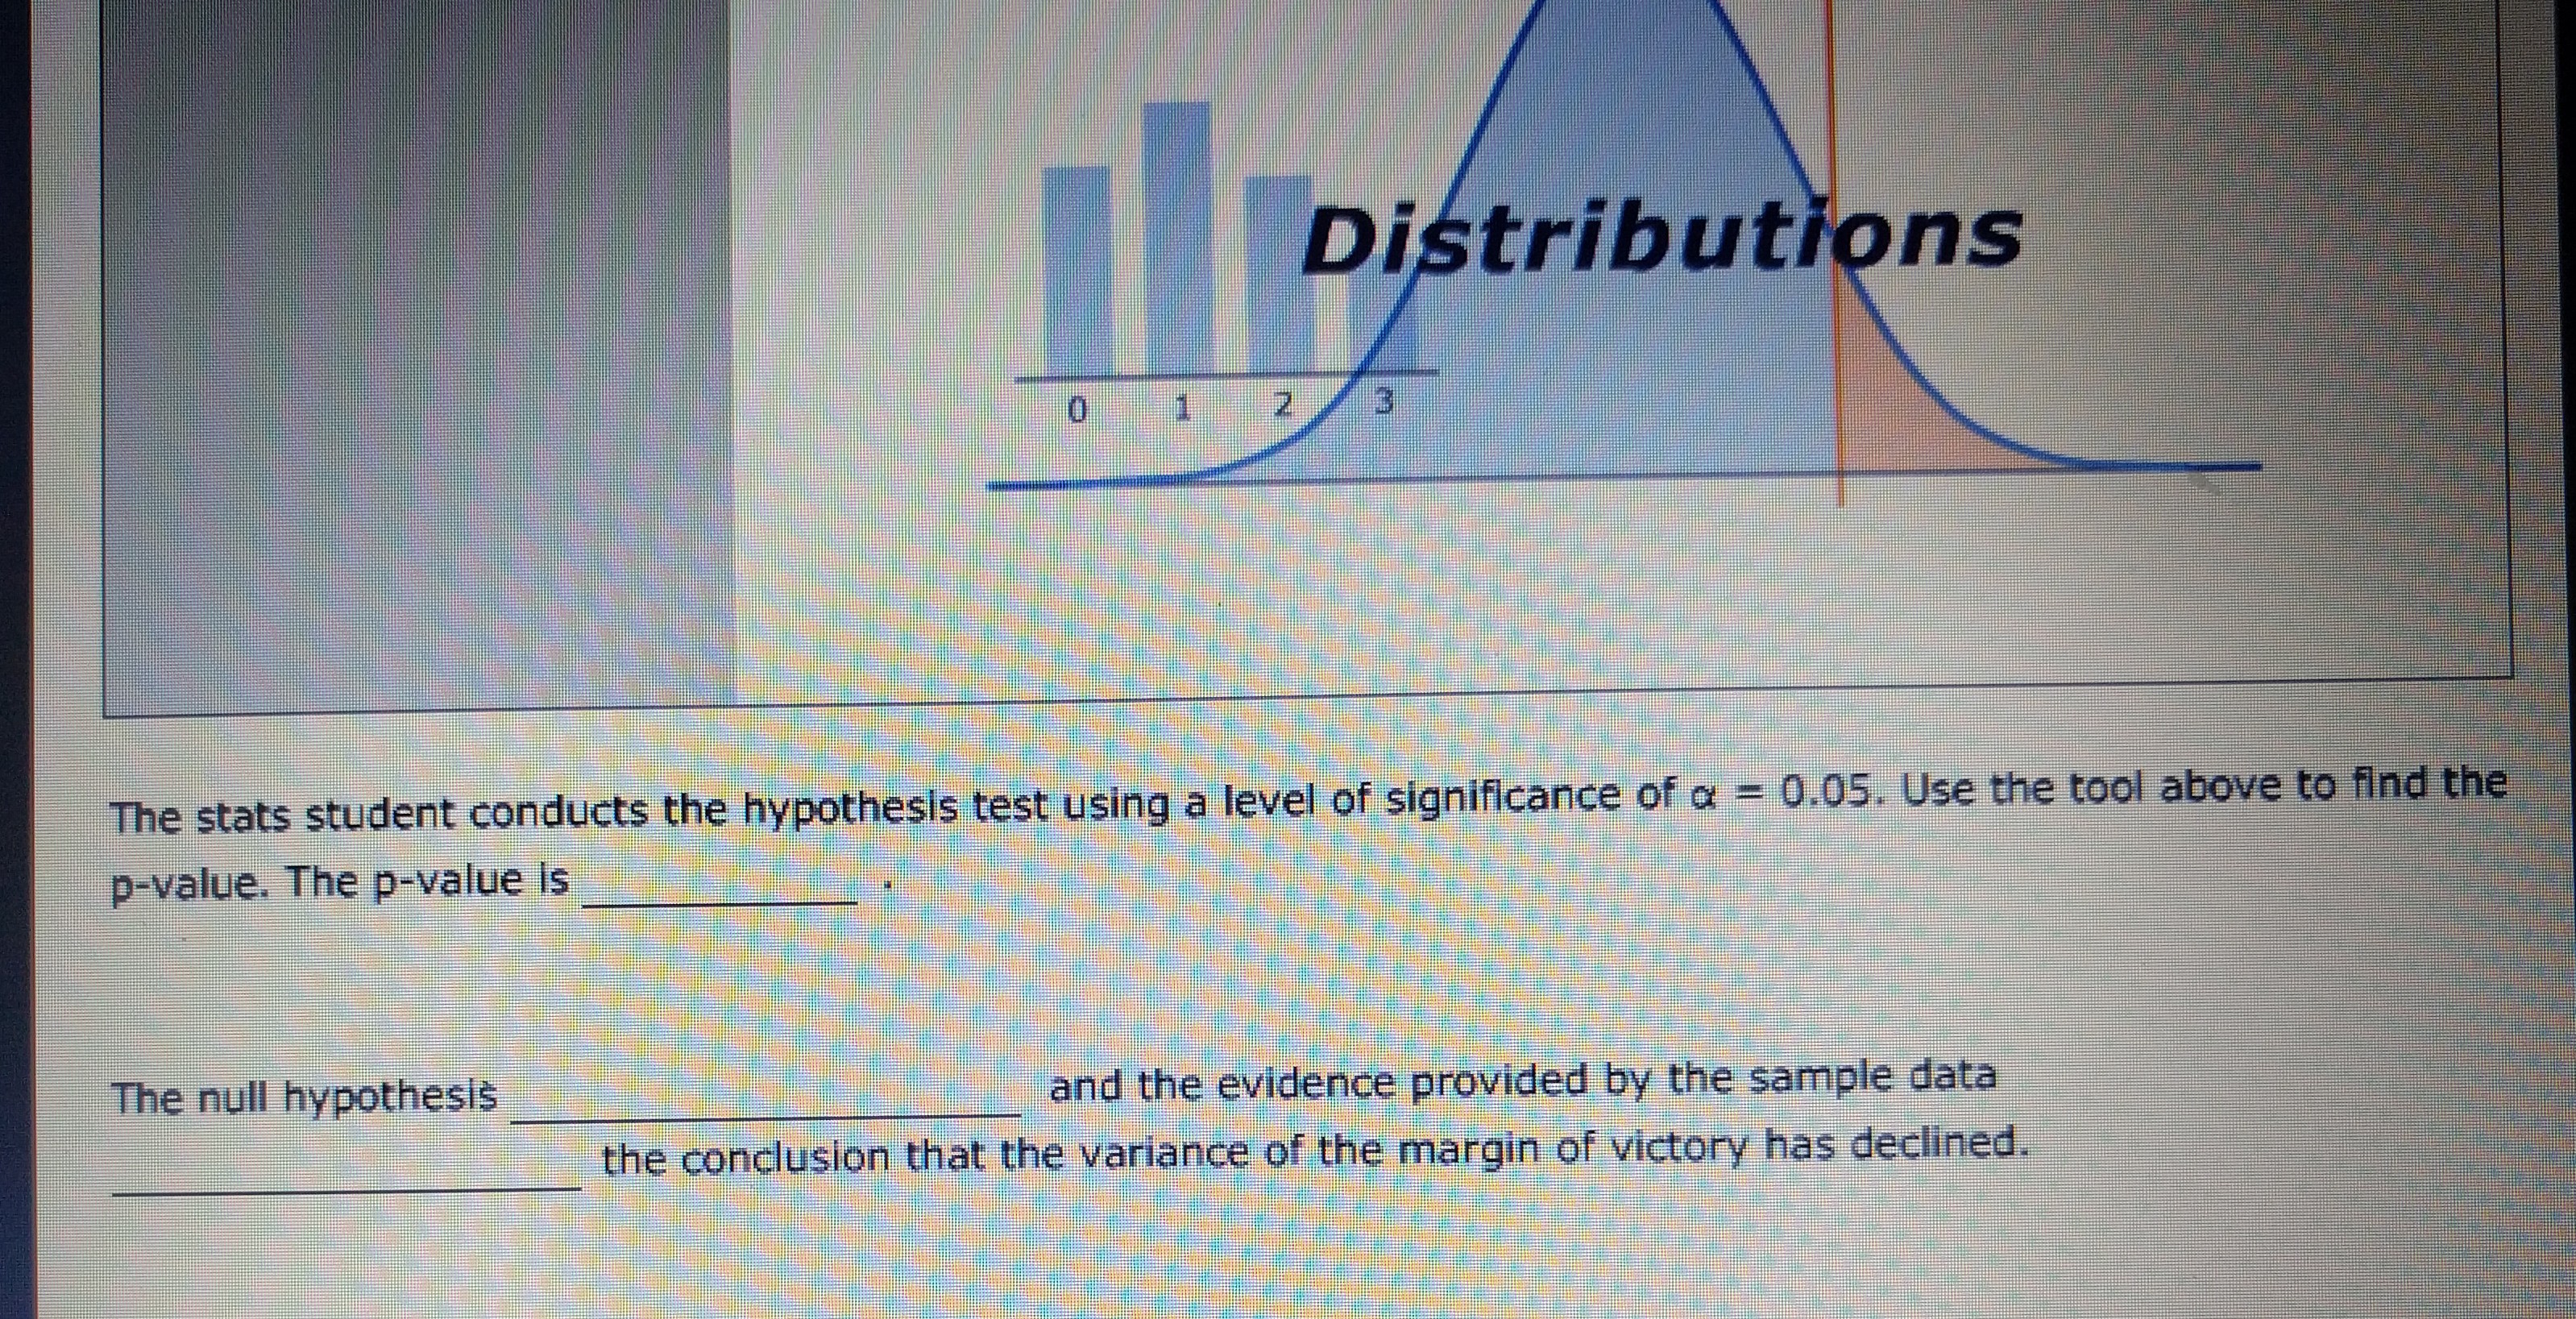
2. Hypothesis testing about a population variance (p-value approach) Summary statistics for the first-round games in the five NCAA basketball tournaments between 2004 and 2008 are displayed below. Margin of Victory (Points)* Matchup Number of Games Mean Variance 1 vs. 16 20 23.7 114.8 2 vs. 15 20 16.4 90.8 3 vs. 14 20 11.9 62.1 4 vs. 13 9.1 149.3 5 vs. 12 5.9 159.1 6 vs. 11 20 5.6 146.5 7 vs. 10 20 83.7 8 vs. 9 20 100.5 The margin of victory is negative for an upset (a win by the lower-seeded team). (Source: Author's calculations from data compiled by The News & Observer.) The NCAA tournament is divided into four regions; 16 teams, seeded 1 to 16, are assigned to each region. In the first round of tournament play in each of the four regions, the 1-seed plays the 16-seed, the 2-seed plays the 15-seed and so on. As a result, in each tournament, there are four opening-round games for each matchup. A college basketball fan (who is also a statistics student) hypothesizes that for a given matchup the margins of victory in the first-round games are more consistent ( as measured by their variance) in recent tournaments than in past tournaments. She decides to conduct a hypothesis test for the 1-vs.-16 matchup. Historically, the variance in the margins of victory for first-round 1-vs.-16 matchups has been o? - 153.8. (153.8 is the variance of the margins of victory for the 1-vs.-16 matchup in first-round tournament games played from 1985 to 1997.) [Source: H. S. Stern and B. Mock, "College Basketball Upsets: Will a 16-Seed Ever Beat a 1-Seed?" Chance, Vol. 11, No. 1, Winter 1998]vol. 11, No. 1, Winter 1998] Assume that the population of first-round victory margins Is normally distributed and that the 20 games summarized In the table constitute a random sample of recent first-round games. The stats student should formulate the hypothesis test as: Ho: 62 2 114.8, Ha: 02 153.8 O Ho: 02 2 153.8, Ha: 02 114.8 The value of the test statistic is Select a Distribution DistributionsDistributions 0 1 2 3 The stats student conducts the hypothesis test using a level of significance of a = 0.05. Use the tool above to find the p-value. The p-value is The null hypothesis and the evidence provided by the sample data the conclusion that the variance of the margin of victory has declined
Step by Step Solution
There are 3 Steps involved in it

Get step-by-step solutions from verified subject matter experts