

Question: I added the data table on 2nd picture... need help answering problem Below is the comparative income statement of Wellington, Inc. (Click the icon to
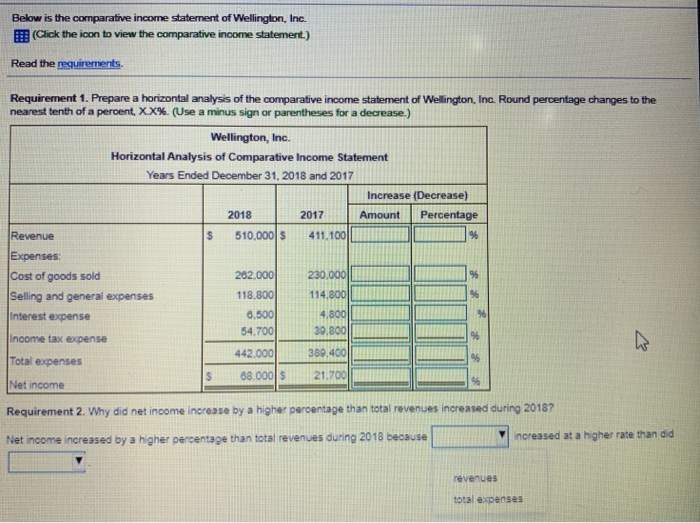
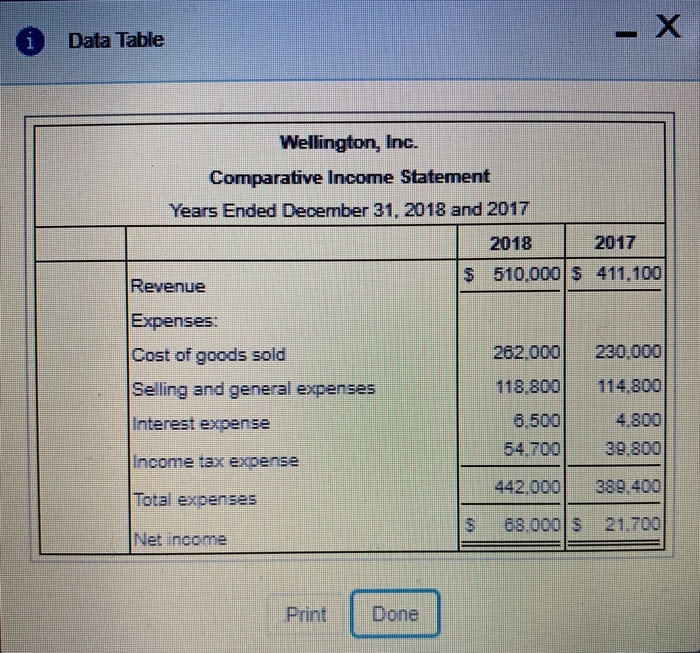
Below is the comparative income statement of Wellington, Inc. (Click the icon to view the comparative income statement.) Read the requirements. Requirement 1. Prepare a horizontal analysis of the comparative income statement of Wellington, Inc. Round percentage changes to the nearest tenth of a percent, XX%. (Use a minus sign or parentheses for a decrease.) Wellington, Inc. Horizontal Analysis of Comparative Income Statement Years Ended December 31, 2018 and 2017 Increase (Decrease) 2018 2017 Amount Percentage Revenue 510,000 $ 411.100L Expenses Cost of goods sold 202.000 Selling and general expenses 118.800 Interest expense 0,500 54.700 Income tax expense 442.000 Total expenses 68.000 Net income Requirement 2. Why did net income increase by a higher percentage than total revenues increased during 2018? Net income increased by a higher percentage than total revenues during 2018 because increased at a higher rate than did total expenses i Data Table - X Wellington, Inc. Comparative Income Statement Years Ended December 31, 2018 and 2017 2018 2017 Revenue $ 510.000 $ 411,100 Expenses: Cost of goods sold 262.000 230.000 Selling and general expenses 118.800 114.800 Interest expense 6.500 4.800 54.700 39.800 Income tax expense Total expenses 442.000 389.400 s 68.000 3 21.700 Net income Print Done
Step by Step Solution
There are 3 Steps involved in it

Get step-by-step solutions from verified subject matter experts