

Question: I am asking a question about business forecasting techniques QMS 703. I have attached the data picture below and asking a, b and c. I
I am asking a question about business forecasting techniques QMS 703.
I have attached the data picture below and asking a, b and c. I know that I need to answer these 3 questions by using R studio.
Could you please answer a by looking at the data picture and provide me solutions and R studio formulas to calculate b and c?
a)Provide a short description of your data, make a proposal on how you can use this data to forecast future values, and discuss the necessary assumption you made in order to conduct meaningful forecasting.
b)Plot the time series and plot autocorrelation function using R. if the time series appear to be non-stationary, then also plot autocorrection function for the first-order difference of the original time series.
c)Comment on the data characteristics based on the results you got from the time series plot and ACF plots.
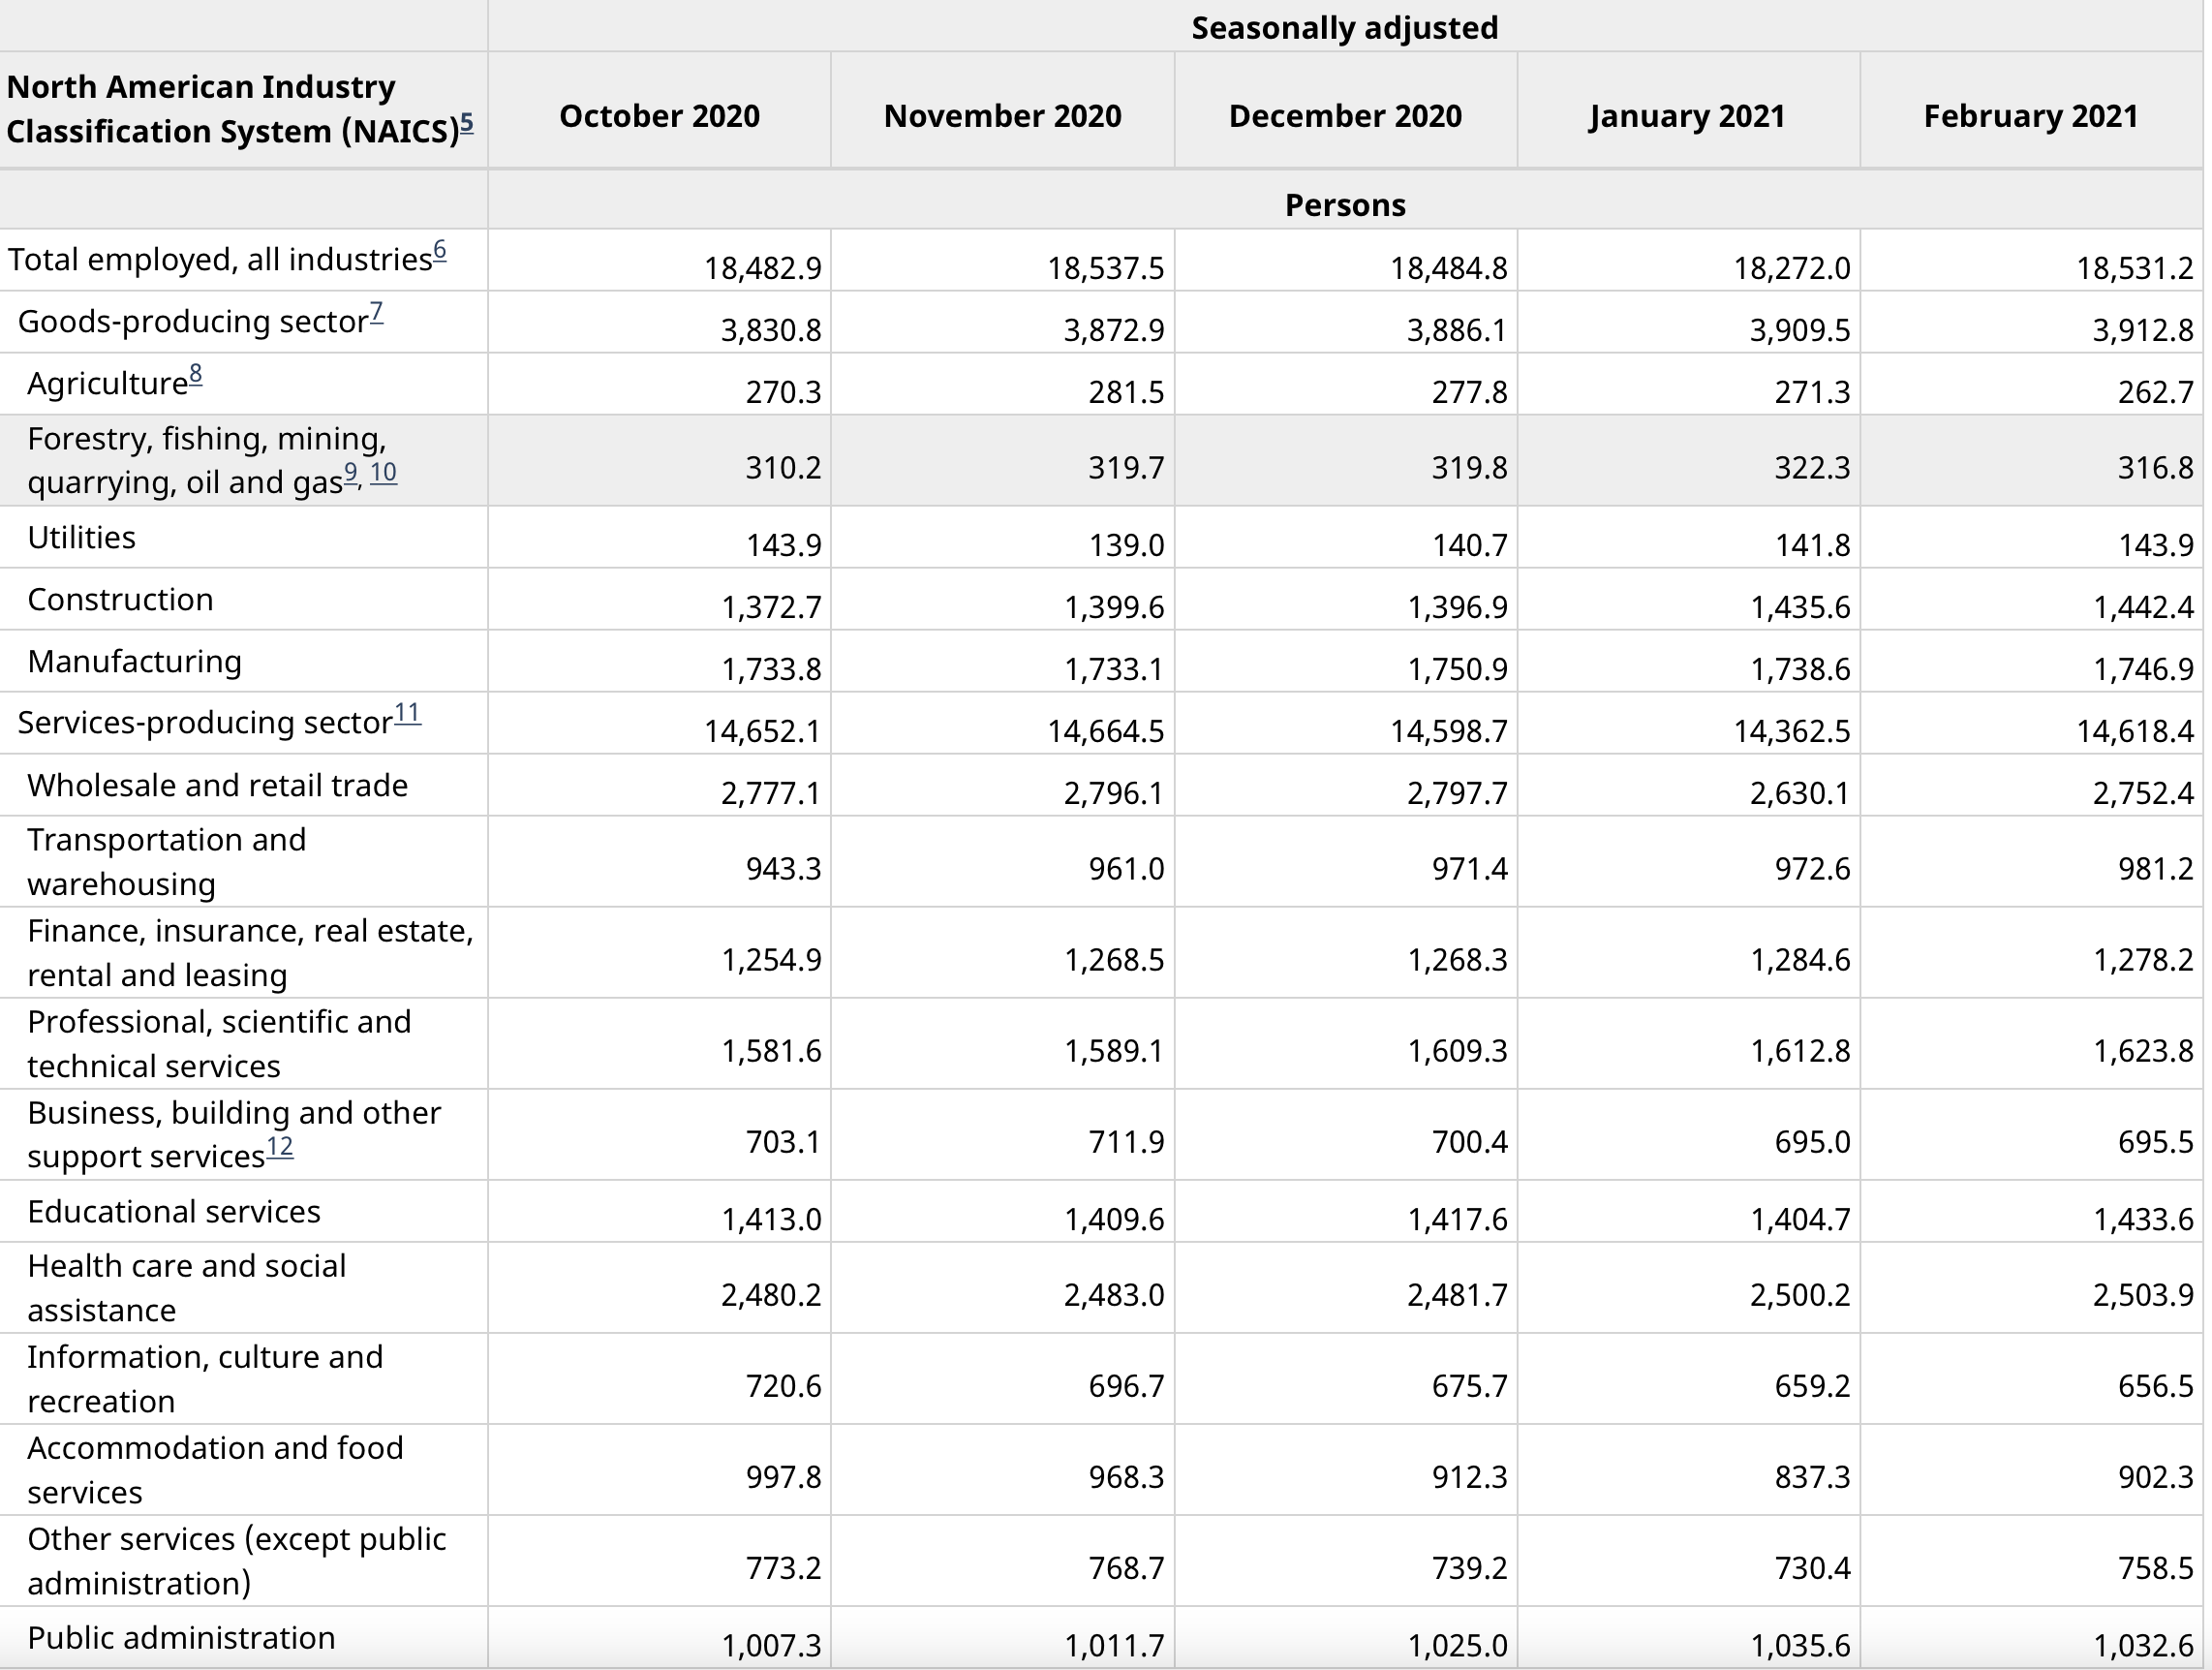
Seasonally adjusted North American Industry Classification System (NAICS)5 October 2020 November 2020 December 2020 January 2021 February 2021 Persons Total employed, all industries 18,482.9 18,537.5 18,484.8 18,272.0 18,531.2 Goods-producing sector- 3,830.8 3,872.9 3,886.1 3,909.5 3,912.8 Agriculture8 270.3 281.5 277.8 271.3 262.7 Forestry, fishing, mining, quarrying, oil and gas9 10 310.2 319.7 319.8 322.3 316.8 Utilities 143.9 139.0 140.7 141.8 143.9 Construction 1,372.7 1,399.6 1,396.9 1,435.6 1,442.4 Manufacturing 1,733.8 1,733.1 1,750.9 1,738.6 1,746.9 Services-producing sector11 14,652.1 14,664.5 14,598.7 14,362.5 14,618.4 Wholesale and retail trade 2,777.1 2,796.1 2,797.7 2,630.1 2,752.4 Transportation and warehousing 943.3 961.0 971.4 972.6 981.2 Finance, insurance, real estate, rental and leasing 1,254.9 1,268.5 1,268.3 1,284.6 1,278.2 Professional, scientific and technical services 1,581.6 1,589.1 1,609.3 1,612.8 1,623.8 Business, building and other support services 703.1 711.9 700.4 695.0 695.5 Educational services 1,413.0 1,409.6 1,417.6 1,404.7 1,433.6 Health care and social assistance 2,480.2 2,483.0 2,481.7 2,500.2 2,503.9 Information, culture and recreation 720.6 696.7 675.7 659.2 656.5 Accommodation and food services 997.8 968.3 912.3 837.3 902.3 Other services (except public administration) 773.2 768.7 739.2 730.4 758.5 Public administration 1,007.3 1,011.7 1,025.0 1,035.6 1,032.6
Step by Step Solution
There are 3 Steps involved in it

Get step-by-step solutions from verified subject matter experts