

Question: I am completely lost, can someone please help? Problem1 This problem involves modifying the fft HW3.m MATLAB file found in the HW folder on Canvas
I am completely lost, can someone please help?
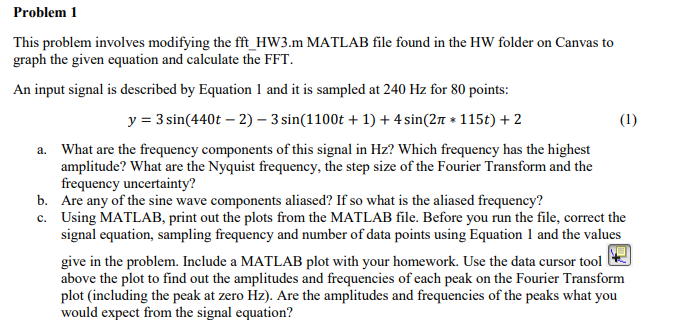
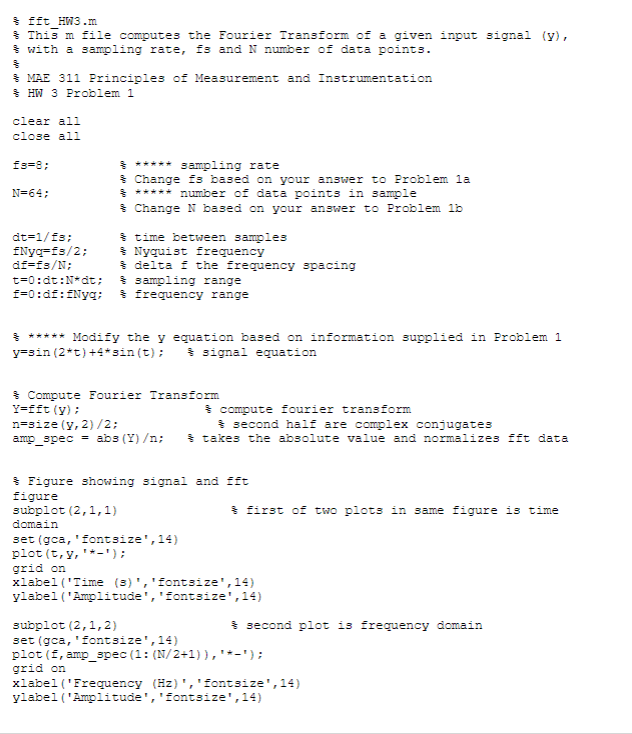
Problem1 This problem involves modifying the fft HW3.m MATLAB file found in the HW folder on Canvas to graph the given equation and calculate the FFT An input signal is described by Equation 1 and it is sampled at 240 Hz for 80 points: y-3 sin(440t-2)-3 sin( 1100t + 1) + 4 sin(2n * 1 15) + 2 What are the frequency components of this signal in Hz? Which frequency has the highest amplitude? What are the Nyquist frequency, the step size of the Fourier Transform and the frequency uncertainty? Are any of the sine wave components aliased? If so what is the aliased frequency? Using MATLAB, print out the plots from the MATLAB file. Before you run the file, correct the signal equation, sampling frequency and number of data points using Equation 1 and the values a. b. c. give in the problem. Include a MATLAB plot with your homework. Use the data cursor tool above the plot to find out the amplitudes and frequencies of each peak on the Fourier Transform plot (including the peak at zero Hz). Are the amplitudes and frequencies of the peaks what you would expect from the signal equation? Problem1 This problem involves modifying the fft HW3.m MATLAB file found in the HW folder on Canvas to graph the given equation and calculate the FFT An input signal is described by Equation 1 and it is sampled at 240 Hz for 80 points: y-3 sin(440t-2)-3 sin( 1100t + 1) + 4 sin(2n * 1 15) + 2 What are the frequency components of this signal in Hz? Which frequency has the highest amplitude? What are the Nyquist frequency, the step size of the Fourier Transform and the frequency uncertainty? Are any of the sine wave components aliased? If so what is the aliased frequency? Using MATLAB, print out the plots from the MATLAB file. Before you run the file, correct the signal equation, sampling frequency and number of data points using Equation 1 and the values a. b. c. give in the problem. Include a MATLAB plot with your homework. Use the data cursor tool above the plot to find out the amplitudes and frequencies of each peak on the Fourier Transform plot (including the peak at zero Hz). Are the amplitudes and frequencies of the peaks what you would expect from the signal equation
Step by Step Solution
There are 3 Steps involved in it

Get step-by-step solutions from verified subject matter experts