

Question: I am confused by this. Please help. Here is a sample data set that appears to be nearly normal (as suggested by the histogram). 74.8
I am confused by this. Please help.
Here is a sample data set that appears to be nearly normal (as suggested by the histogram).
| 74.8 | 69.9 | 79.7 | 90.8 | 79.2 | 73.4 | 71.9 |
| 74.6 | 78.1 | 58.6 | 57.8 | 78.5 | 74.2 | 78.5 |
| 68.8 | 80.1 | 86.2 | 68 | 74.8 | 60.6 | 77.7 |
| 89 | 81.1 | 76.8 | 85.7 | 77.9 | 77.9 | 76.8 |
| 86.2 | 74.6 | 79.2 | 62.6 | 76.4 | 67.7 | 70.8 |
| 75.2 | 82 | 84 | 73 | 67 | 65.6 | 67.4 |
| 80.9 | 90 | 73 | 80.1 | 81.2 | 63.2 | 69.9 |
| 67.4 | 70.1 | 71.9 | 69.6 | 84.8 | 74.2 | 78.7 |
| 79.9 | 82.6 | 70.3 | 68.8 | 71.9 | 81.5 | 74.4 |
| 70.3 | 83.3 | 72.8 | 74.4 | 85.7 | 71.9 | 74.6 |
Here is the histogram:
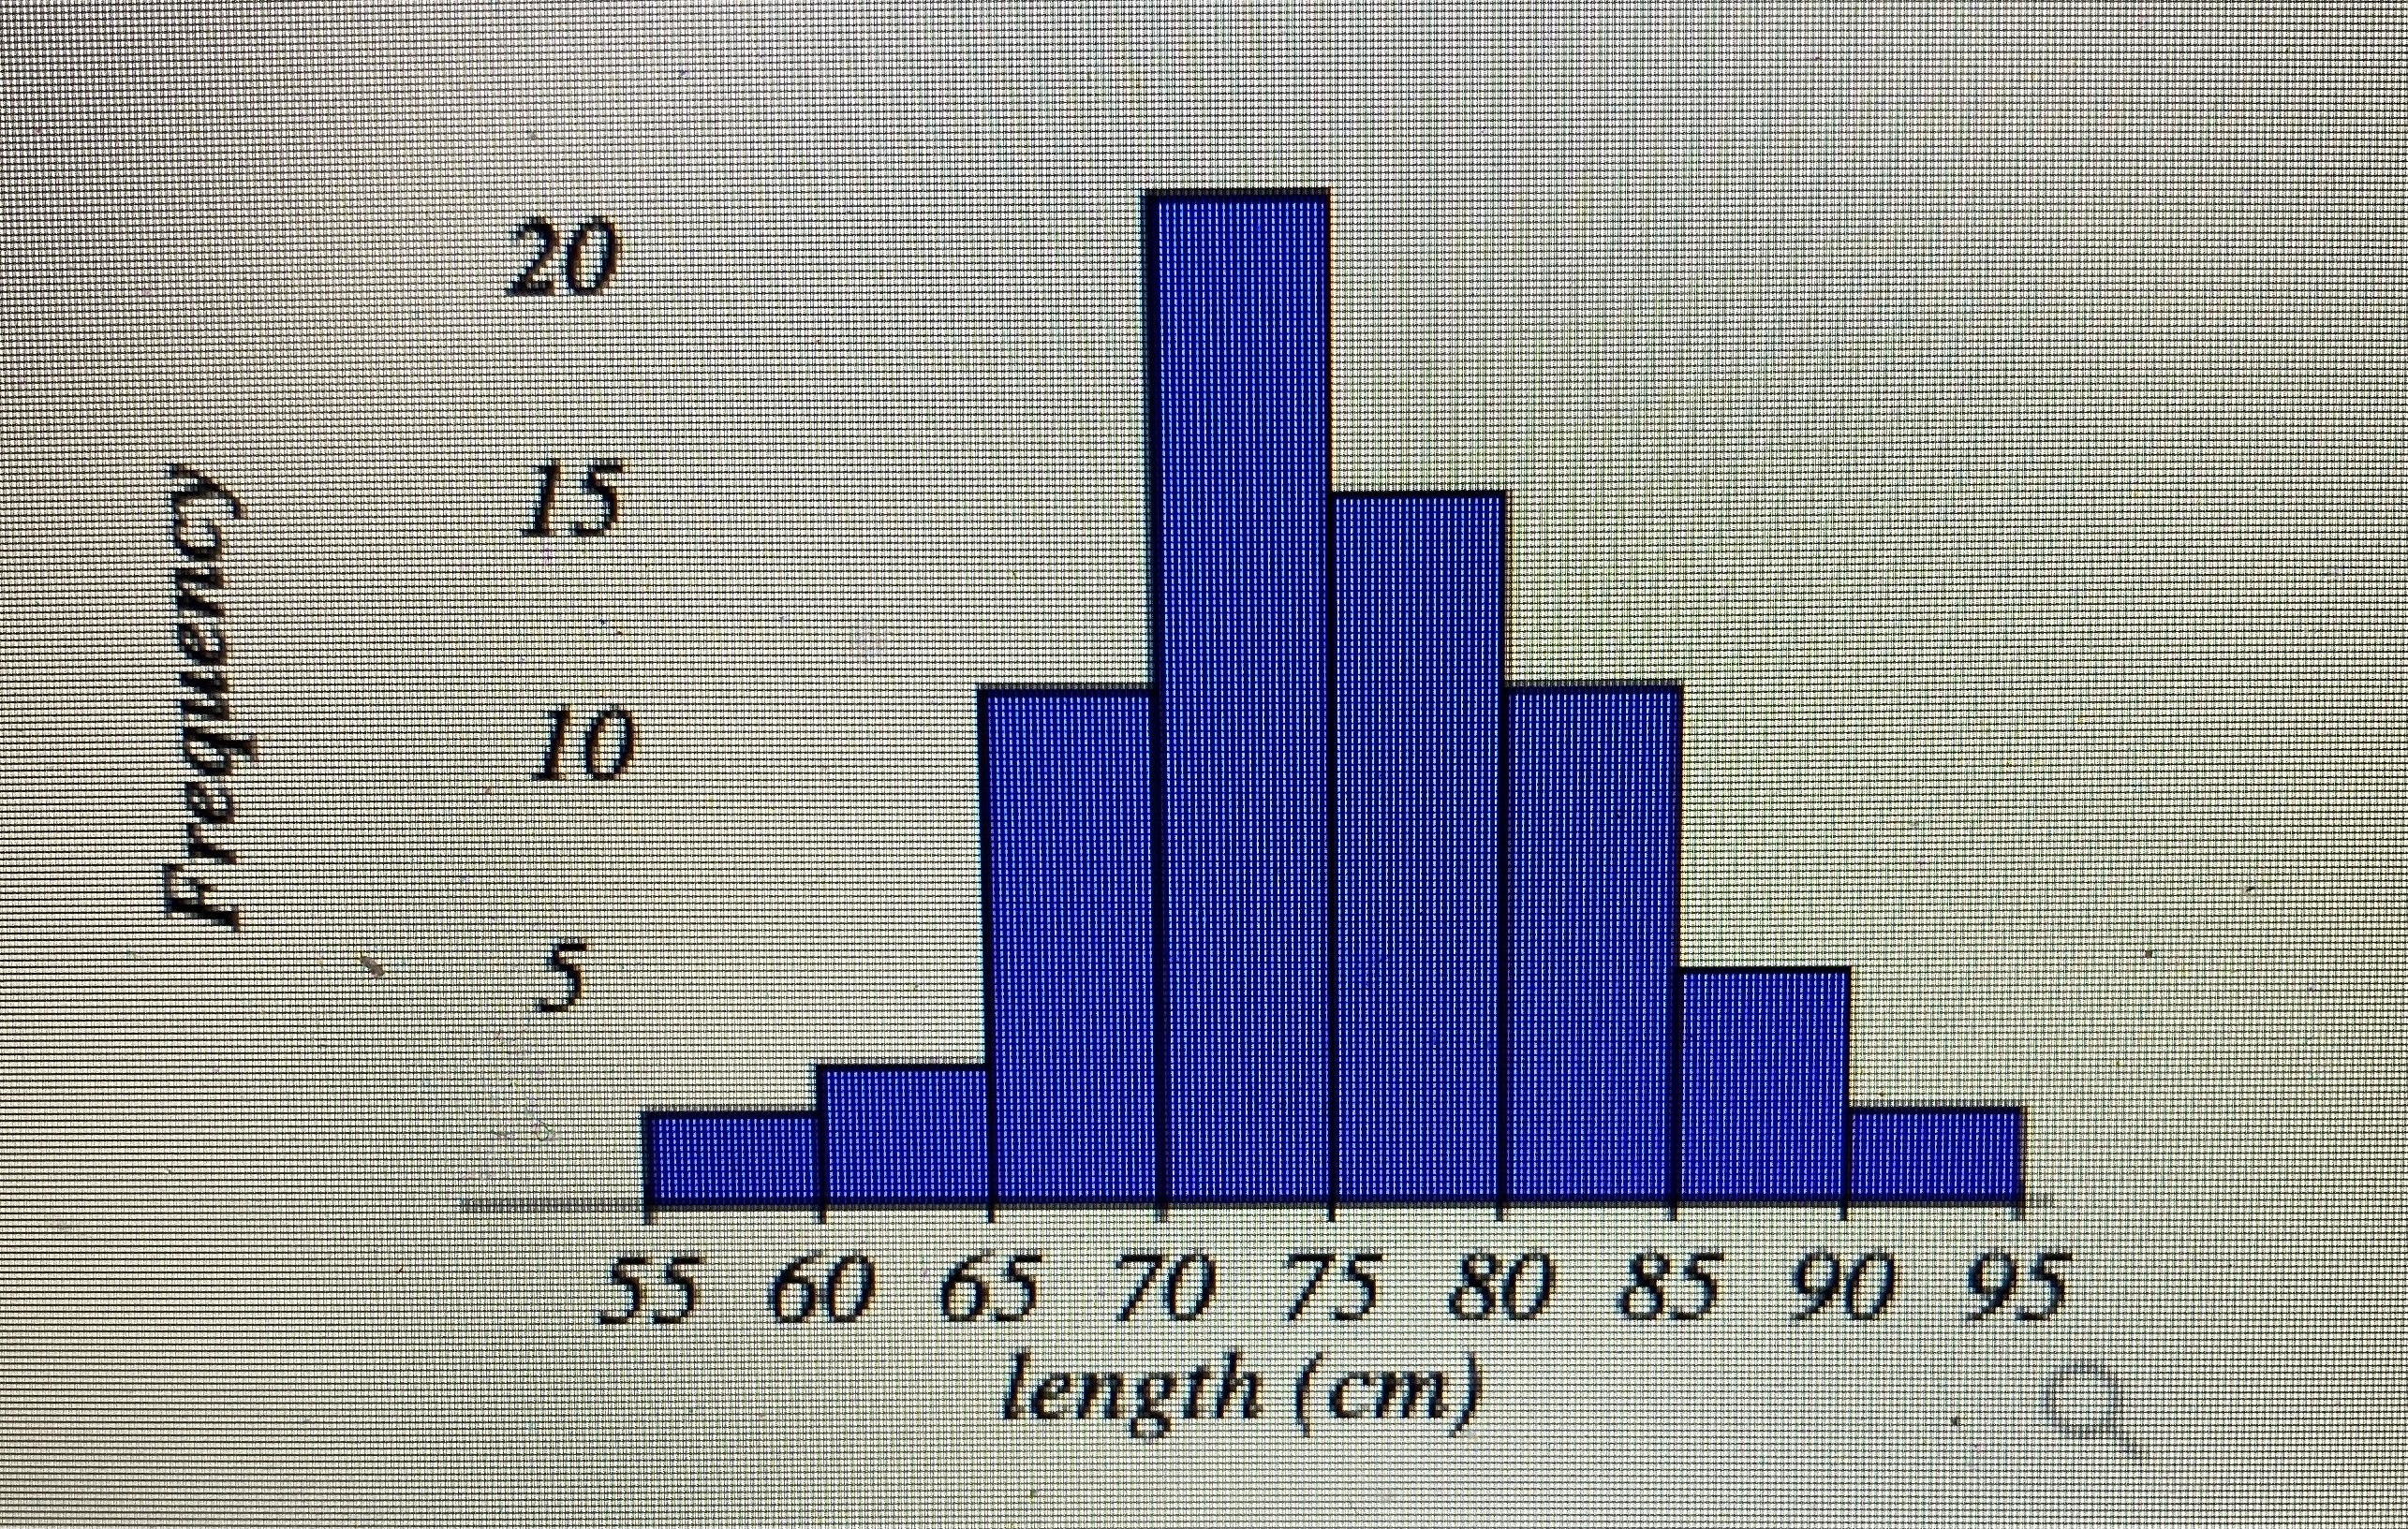
20 15 Frequency 10 5 55 60 65 70 75 80 85 90 95 length (cm)
Step by Step Solution
There are 3 Steps involved in it
1 Expert Approved Answer
Step: 1 Unlock

Question Has Been Solved by an Expert!
Get step-by-step solutions from verified subject matter experts
Step: 2 Unlock
Step: 3 Unlock