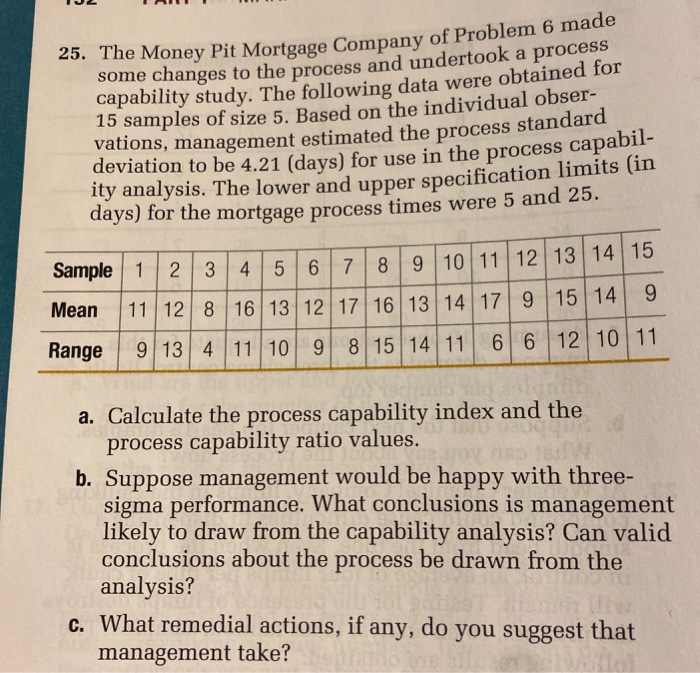
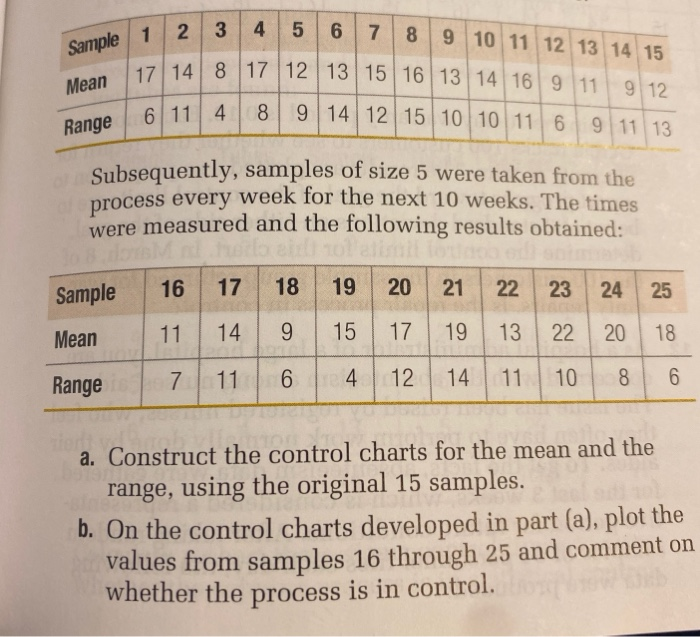
Question: I am going to include the original data from Problem 6 in case needed. IJ2 25. The Money Pit Mortgage Co Money Pit Mortgage Company

I am going to include the original data from
I am going to include the original data from Problem 6 in case needed.
I am going to include the original data from
IJ2 25. The Money Pit Mortgage Co Money Pit Mortgage Company of Problem 6 made some changes to the process and undertook a process capability study. The following data were obtained for 15 samples of size 5. Based on the individual obser- vations, management estimated the process stan deviation to be 4.21 (davs) for use in the process capabil ity analysis. The lower and upper specification days) for the mortgage process times were 5 and 25. Sample 1 2 3 4 5 6 7 8 9 10 11 12 13 14 15 Mean 11 12 8 16 13 12 17 16 13 14 17 9 15 14 9 Range 913 4 11 10 9 8 15 14 11 6 6 12 10 11 a. Calculate the process capability index and the process capability ratio values. b. Suppose management would be happy with three- sigma performance. What conclusions is management likely to draw from the capability analysis? Can valid conclusions about the process be drawn from the analysis? C. What remedial actions, if any, do you suggest that management take? 6. The Money Pit Mortgage Company is interested in moni- toring the performance of the mortgage process. Fifteen 2 1 3 4 Sample 1 2 3 148 4 5 6 7 8 17 12 13 15 16 8 9 14 | 12 | 15 9 10 11 12 13 14 15 13 14 16 g 11 g 12 10 10 11 6 9 11 13 6 11 4 Subsequently, samples of size 5 were taken from the ocess every week for the next 10 weeks. The times were measured and the following results obtained: Sample Mean Range 16 11 7 17 14 11 18 9 6 19 15 4 20 17 12 21 19 14 22 13 11 23 22 10 24 20 8 25 18 6 a. Construct the control charts for the mean and the range, using the original 15 samples. b. On the control charts developed in part (a), plot the values from samples 16 through 25 and comment on whether the process is in control C. In part (b), if you concluded that the process was out of control, would you attribute it to a drift in the mean, an increase in the variability, or both? Explain your

Step by Step Solution

There are 3 Steps involved in it

1 Expert Approved Answer
Step: 1 Unlock blur-text-image
Question Has Been Solved by an Expert!

Get step-by-step solutions from verified subject matter experts

Step: 2 Unlock
Step: 3 Unlock

Students Have Also Explored These Related General Management Questions!