

Question: I am having difficulty coding this. May I please get help with this? Please write in Python Problem 1. Quadratic Equations A quadratic equation has
I am having difficulty coding this. May I please get help with this? Please write in Python
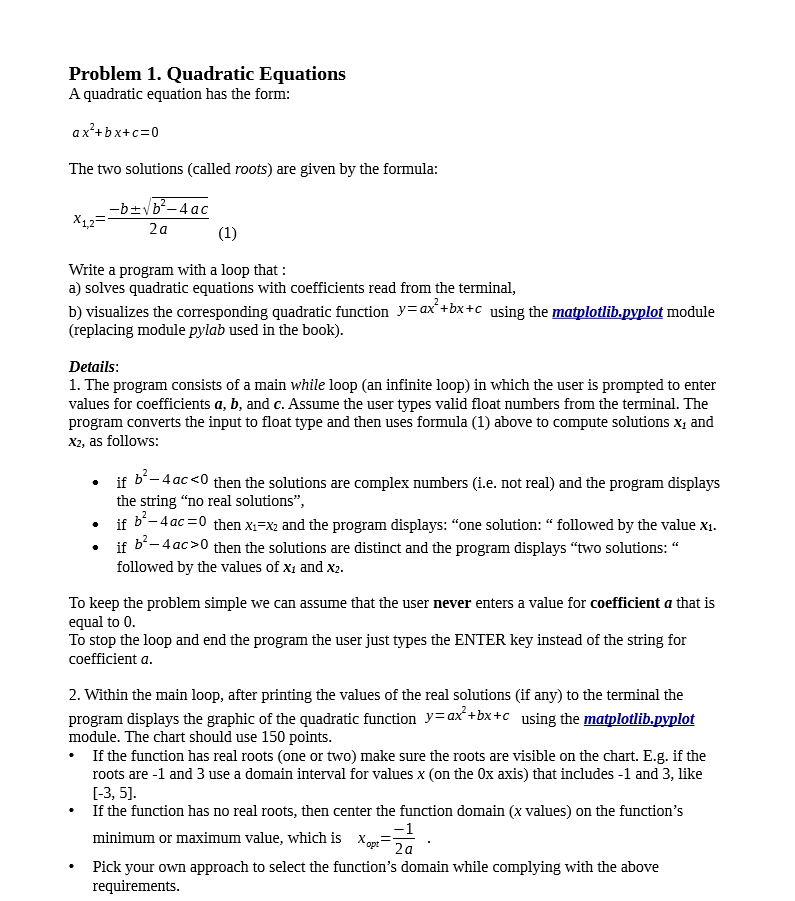
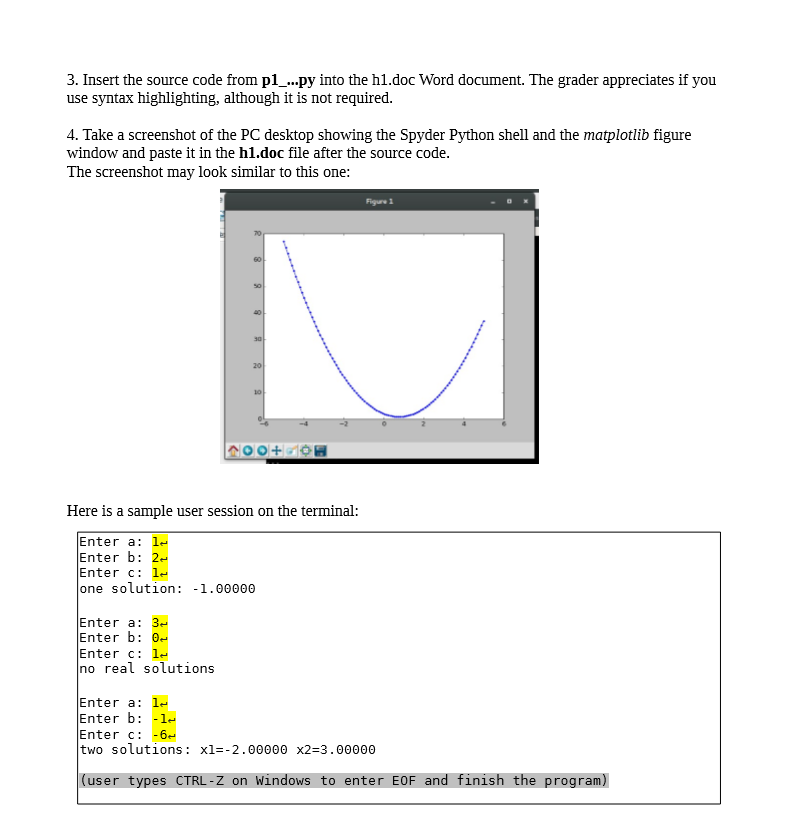
Problem 1. Quadratic Equations A quadratic equation has the form: ax?+bx+c=0 The two solutions (called roots) are given by the formula: X12= --buvb-4ac 2a (1) Write a program with a loop that: a) solves quadratic equations with coefficients read from the terminal, b) visualizes the corresponding quadratic function y=ax +bx+c using the matplotlib.pyplot module (replacing module pylab used in the book). Details: 1. The program consists of a main while loop (an infinite loop) in which the user is prompted to enter values for coefficients a, b, and c. Assume the user types valid float numbers from the terminal. The program converts the input to float type and then uses formula (1) above to compute solutions X1 and X2, as follows: . if b* - 4ac then the solutions are distinct and the program displays "two solutions: followed by the values of Xi and X2. To keep the problem simple we can assume that the user never enters a value for coefficient a that is equal to 0. To stop the loop and end the program the user just types the ENTER key instead of the string for coefficient a. 2. Within the main loop, after printing the values of the real solutions (if any) to the terminal the program displays the graphic of the quadratic function y=ax+bx+c using the matplotlib.pyplot module. The chart should use 150 points. If the function has real roots (one or two) make sure the roots are visible on the chart. E.g. if the roots are -1 and 3 use a domain interval for values x (on the Ox axis) that includes -1 and 3, like (-3, 5]. If the function has no real roots, then center the function domain (x values) on the function's minimum or maximum value, which is ont= Pick your own approach to select the function's domain while complying with the above requirements. 3. Insert the source code from p1_...py into the h1.doc Word document. The grader appreciates if you use syntax highlighting, although it is not required. 4. Take a screenshot of the PC desktop showing the Spyder Python shell and the matplotlib figure window and paste it in the h1.doc file after the source code. The screenshot may look similar to this one: Figure 1 100+60 Here is a sample user session on the terminal: Enter a: le Enter b: 2- Enter c: le one solution: -1.00000 Enter a: 32 Enter b: 0 Enter c: le no real solutions Enter a: le Enter b: -le Enter c: -62 two solutions: xl=-2.00000 x2=3.00000 (user types CTRL-Z on Windows to enter EOF and finish the program)
Step by Step Solution
There are 3 Steps involved in it

Get step-by-step solutions from verified subject matter experts