

Question: I am having trouble calculating the right frequency for data using excel. The procedure called for =randbetween(1,6) for two columns. After doing this we were
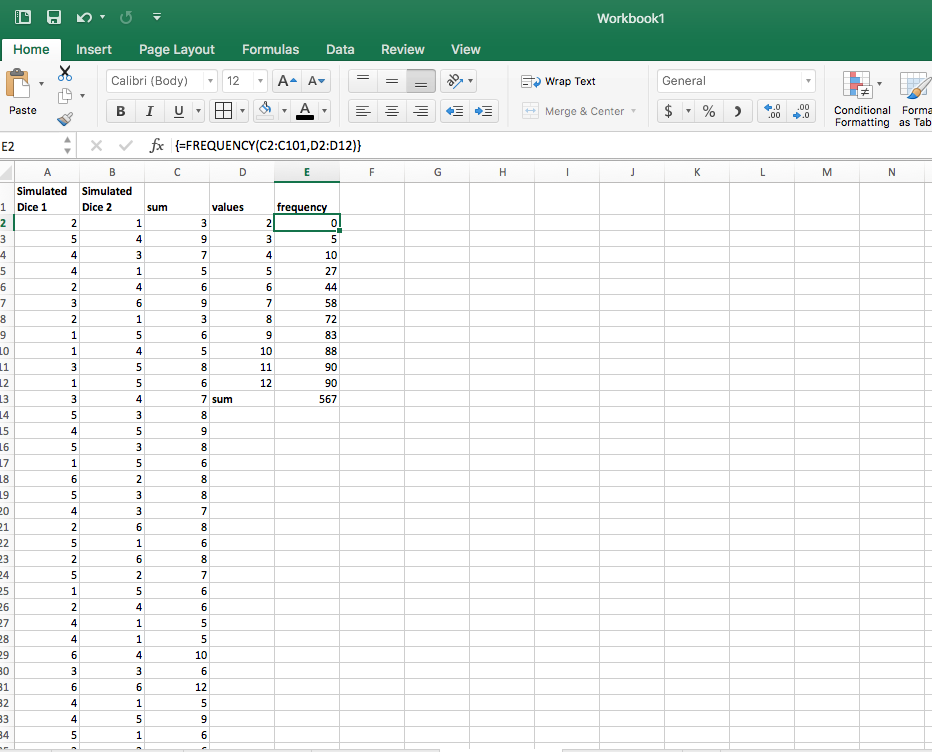
I am having trouble calculating the right frequency for data using excel. The procedure called for =randbetween(1,6) for two columns. After doing this we were to sum the values rolled at a2&b2, a3&b3, etc. using a range of values between 2-12, we were to calculate the frequency. However, no matter how I try to do this, my number is coming out wrong. the sum of the frequencies at the end should be 100 but my results are coming out crazy. What am I doing wrong?
Workbook1 Home Insert Page Layout Formulas Data Review View Calibri (Body) 12 AAv- Wrap Text General Paste Merge & Center $ % , .00 .00 Conditional Forma Formatting as Tab : v/ {=FREQUENCY(C2:C101,D2:D12)) Simulated Simulated 1 Dice 1 Dice 2 values uen 27 72 7 sum 26 0
Step by Step Solution
There are 3 Steps involved in it

Get step-by-step solutions from verified subject matter experts