

Question: I am having trouble figuring out the code to display several variables in one box plot. In other words, I need to display at leave
I am having trouble figuring out the code to display several variables in one box plot. In other words, I need to display at leave 7 of the variables as side by side box plot. I can do it individually, but how do I write for the variables to display next to each other?
See image for the problem
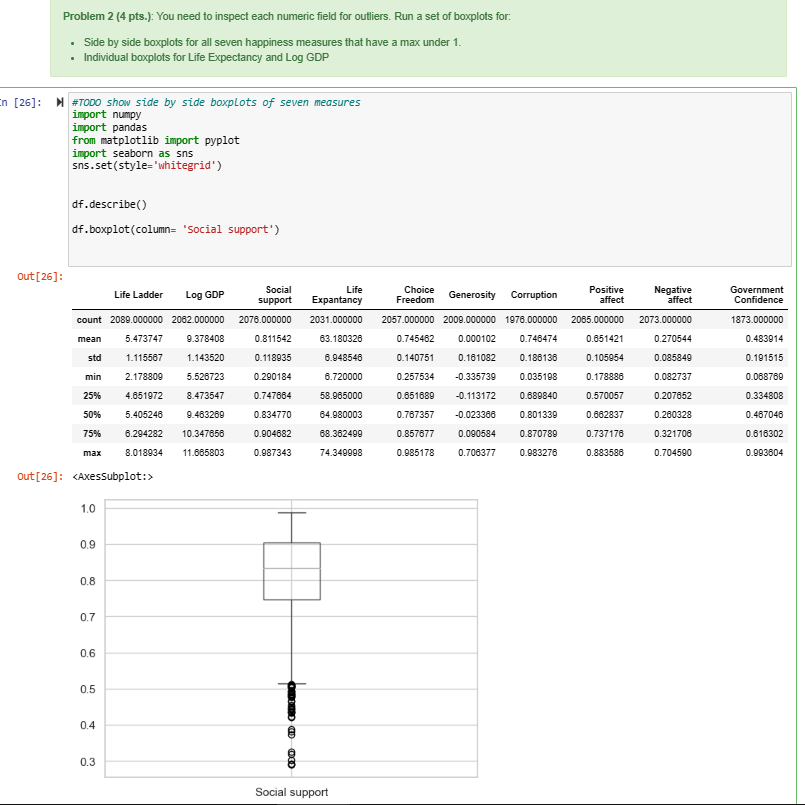
Problem 2 (4 pts.): You need to inspect each numeric field for outliers. Run a set of boxplots for: - Side by side boxplots for all seven happiness measures that have a max under 1. - Individual boxplots for Life Expectancy and Log GDP \#TOoo show side by side boxplots of seven measures import numpy import pandas from matplotlib import pyplot import seaborn as sns sns.set(style="whitegrid') df.describe() df.boxplot(column= 'Social support')
Step by Step Solution
There are 3 Steps involved in it

Get step-by-step solutions from verified subject matter experts