

Question: I am having trouble figuring out this question. I do not understand. 2.32 Frequency tables, histograms, and basketball wins: Here are the number of wins
I am having trouble figuring out this question. I do not understand.
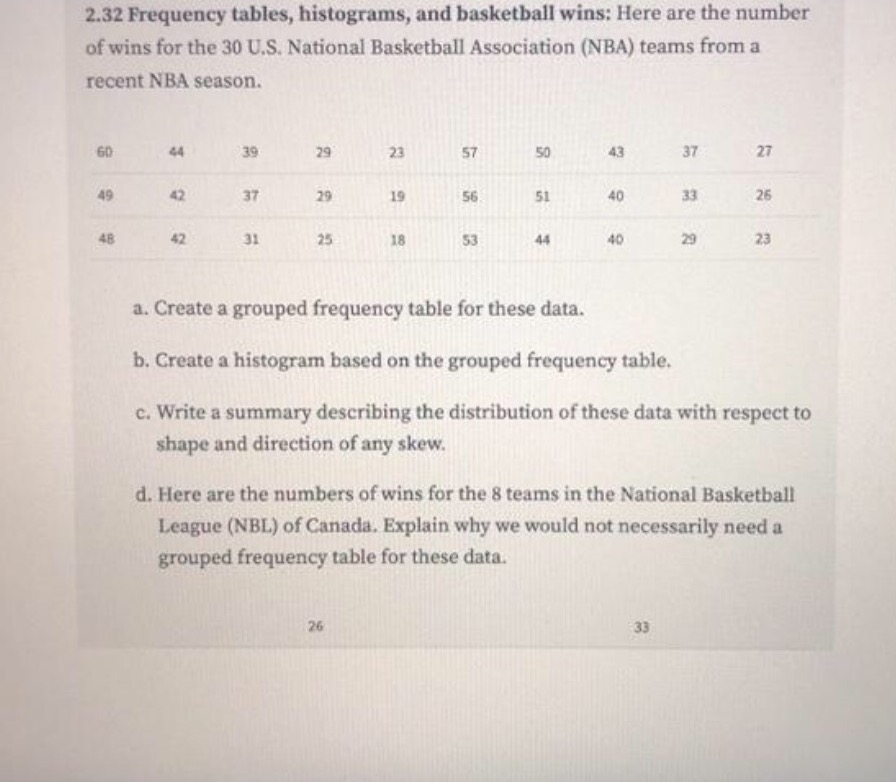
2.32 Frequency tables, histograms, and basketball wins: Here are the number of wins for the 30 U.S. National Basketball Association (NBA) teams from a recent NBA season. GD 70 29 23 57 43 37 27 37 29 19 56 51 33 26 42 31 25 18 53 44 40 20 23 a. Create a grouped frequency table for these data. b. Create a histogram based on the grouped frequency table. c. Write a summary describing the distribution of these data with respect to shape and direction of any skew. d. Here are the numbers of wins for the 8 teams in the National Basketball League (NBL) of Canada. Explain why we would not necessarily need a grouped frequency table for these data. 26 33
Step by Step Solution
There are 3 Steps involved in it

Get step-by-step solutions from verified subject matter experts