

Question: I am having trouble figuring this problem out, I don't know how the graph would change for the change in temperature, and I can't find
I am having trouble figuring this problem out, I don't know how the graph would change for the change in temperature, and I can't find anything that explains what effect this would have on the operating line
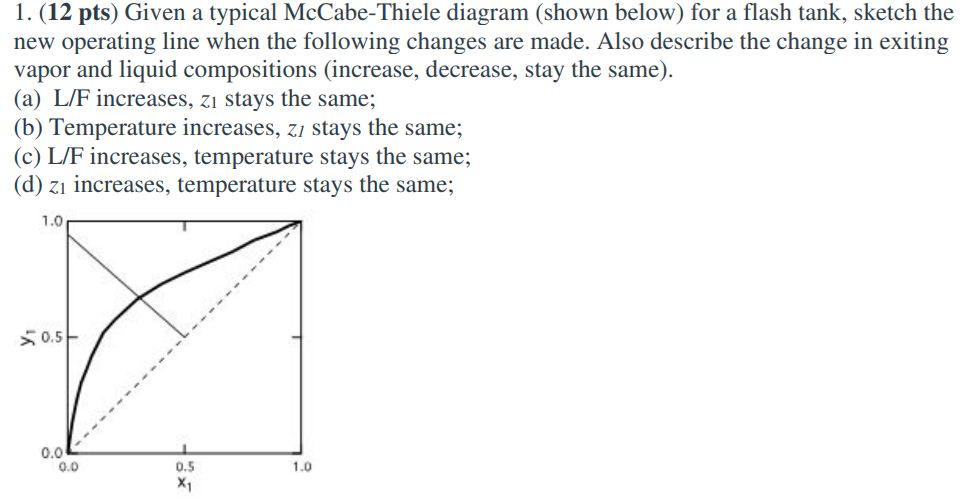
1. (12 pts) Given a typical McCabe-Thiele diagram (shown below) for a flash tank, sketch the new operating line when the following changes are made. Also describe the change in exiting vapor and liquid compositions (increase, decrease, stay the same). (a) L/F increases, zi stays the same; (b) Temperature increases, zi stays the same; (c) L/F increases, temperature stays the same; (d) z increases, temperature stays the same; 1.0 50.5 0.0 0.0 1.0 0.5 X1
Step by Step Solution
There are 3 Steps involved in it

Get step-by-step solutions from verified subject matter experts