

Question: I am having trouble with this problem and cannot get it. Could someone please help me with this one? Graph 1 shows the distribution of
I am having trouble with this problem and cannot get it. Could someone please help me with this one?
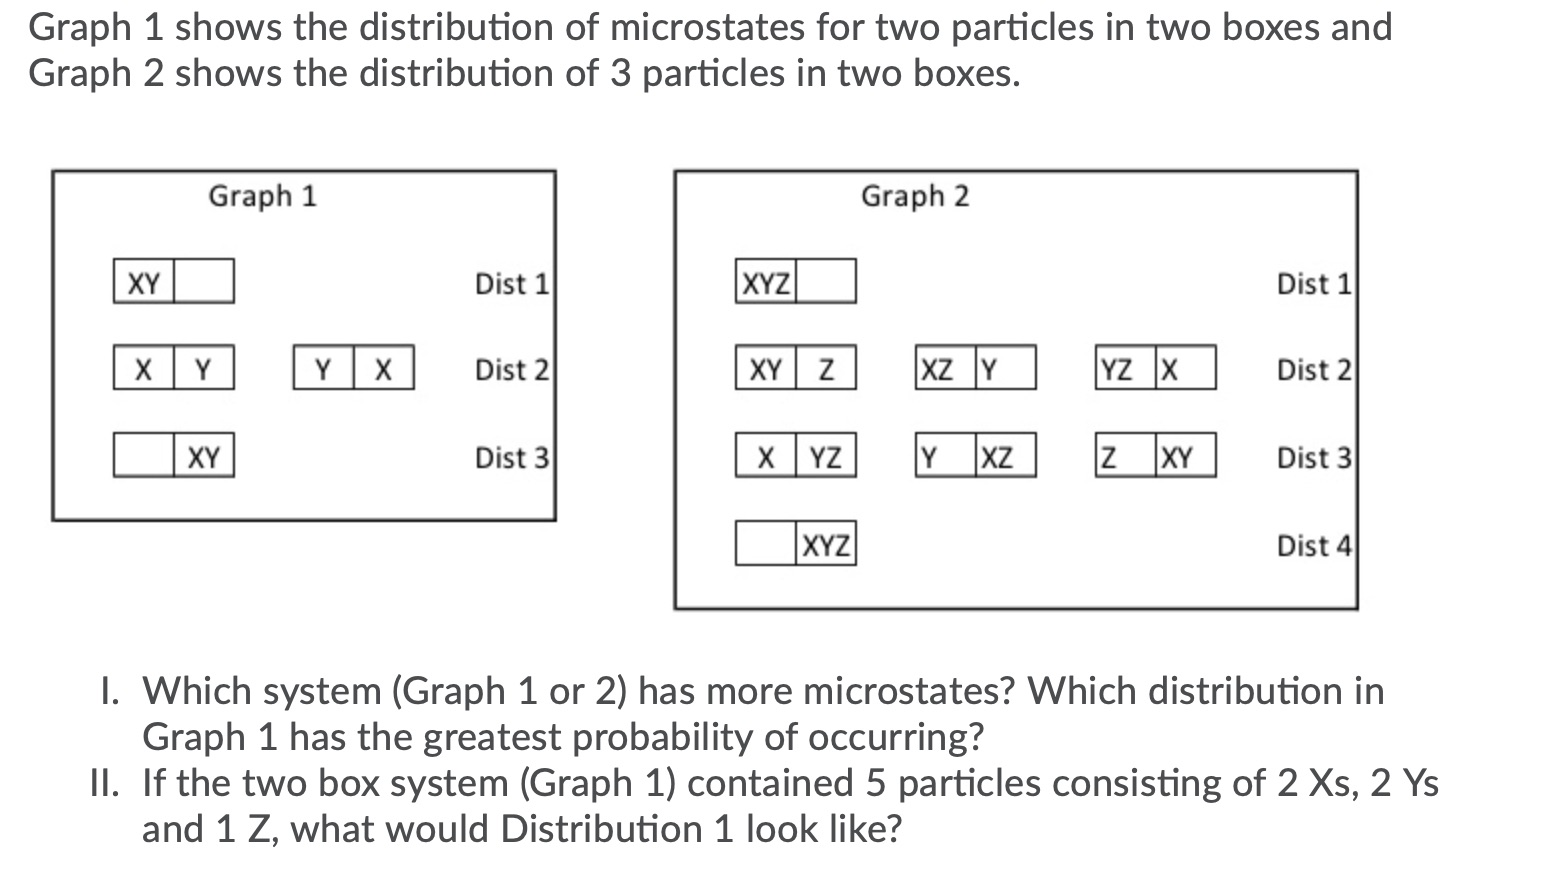
Graph 1 shows the distribution of microstates for two particles in two boxes and Graph 2 shows the distribution of 3 particles in two boxes. I. Which system (Graph 1 or 2) has more microstates? Which distribution in Graph 1 has the greatest probability of occurring? II. If the two box system (Graph 1) contained 5 particles consisting of 2 X5, 2 Y5 and 1 2, what would Distribution 1 look like
Step by Step Solution
There are 3 Steps involved in it
1 Expert Approved Answer
Step: 1 Unlock

Question Has Been Solved by an Expert!
Get step-by-step solutions from verified subject matter experts
Step: 2 Unlock
Step: 3 Unlock