

Question: I am having trouble with this problem, I know my if/ elseif statements are correct the only issue I am having is with what the
I am having trouble with this problem, I know my if/ elseif statements are correct the only issue I am having is with what the variable to use for the For statement. I'm currently using what was shown in out lecture notes but when I try to plot nothing shows up. Any help is appreciated.
Here is my code:
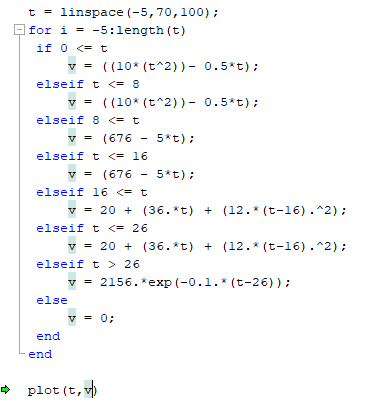
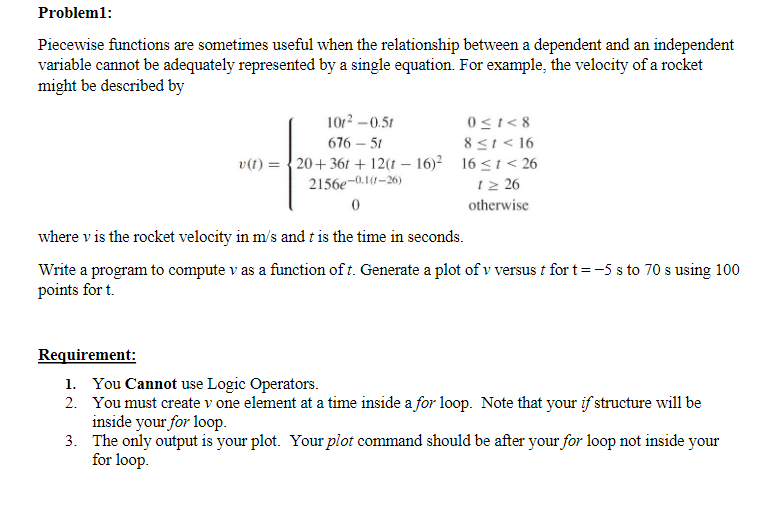
Probleml: Piecewise functions are sometimes useful when the relationship between a dependent and an independent variable cannot be adequately represented by a single equation. For example, the velocity of a rocket might be described by 1012 -0.51 0 26 0 otherwise where v is the rocket velocity in m/s and t is the time in seconds. Write a program to compute v as a function of t. Generate a plot of v versust for t=-5 s to 70 s using 100 points for t. Requirement: 1. You Cannot use Logic Operators. 2. You must create v one element at a time inside a for loop. Note that your if structure will be inside your for loop. 3. The only output is your plot. Your plot command should be after your for loop not inside your for loop. t = linspace (-5,70,100); for i = -5:length(t) if 0 26 v = 2156.*exp(-0.1.*(t-26)); else v = 0; end -end plot(t, ut
Step by Step Solution
There are 3 Steps involved in it

Get step-by-step solutions from verified subject matter experts