

Question: I am looking for solution to the below questions, please get back and let me know the solution soon. I do have an excel which
I am looking for solution to the below questions, please get back and let me know the solution soon. I do have an excel which might be helpful for this, so let me know how to share it. I have also attached the question in image form.
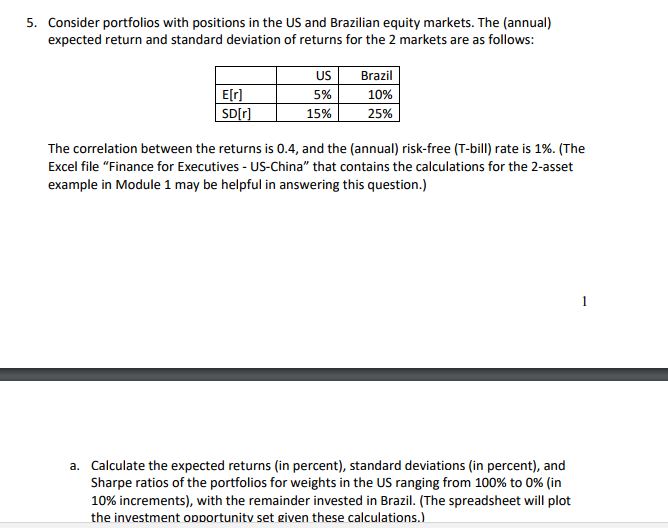
5. Consider portfolios with positions in the US and Brazilian equity markets. The (annual) expected return and standard deviation of returns for the 2 markets are as follows: US Brazil E[r] 5% 10% SD[r] 15% 25% The correlation between the returns is 0.4, and the (annual) risk-free (T-bill) rate is 1%. (The Excel file "Finance for Executives - US-China" that contains the calculations for the 2-asset example in Module 1 may be helpful in answering this question.) 2
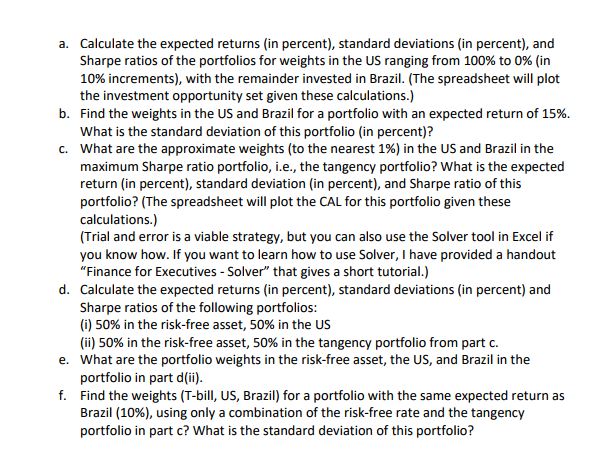
a. Calculate the expected returns (in percent), standard deviations (in percent), and Sharpe ratios of the portfolios for weights in the US ranging from 100% to 0% (in 10% increments), with the remainder invested in Brazil. (The spreadsheet will plot the investment opportunity set given these calculations.)
b. Find the weights in the US and Brazil for a portfolio with an expected return of 15%. What is the standard deviation of this portfolio (in percent)?
c. What are the approximate weights (to the nearest 1%) in the US and Brazil in the maximum Sharpe ratio portfolio, i.e., the tangency portfolio? What is the expected return (in percent), standard deviation (in percent), and Sharpe ratio of this portfolio? (The spreadsheet will plot the CAL for this portfolio given these calculations.) (Trial and error is a viable strategy, but you can also use the Solver tool in Excel if you know how. If you want to learn how to use Solver, I have provided a handout "Finance for Executives - Solver" that gives a short tutorial.)
d. Calculate the expected returns (in percent), standard deviations (in percent) and Sharpe ratios of the following portfolios: (i) 50% in the risk-free asset, 50% in the US (ii) 50% in the risk-free asset, 50% in the tangency portfolio from part c.
e. What are the portfolio weights in the risk-free asset, the US, and Brazil in the portfolio in part d(ii).
f. Find the weights (T-bill, US, Brazil) for a portfolio with the same expected return as Brazil (10%), using only a combination of the risk-free rate and the tangency portfolio in part c? What is the standard deviation of this portfolio


Step by Step Solution
There are 3 Steps involved in it

Get step-by-step solutions from verified subject matter experts