

Question: I am needing a second opinion on this specific problems and questions. I worked it out but I am not sure I did the problem
I am needing a second opinion on this specific problems and questions. I worked it out but I am not sure I did the problem correctly.
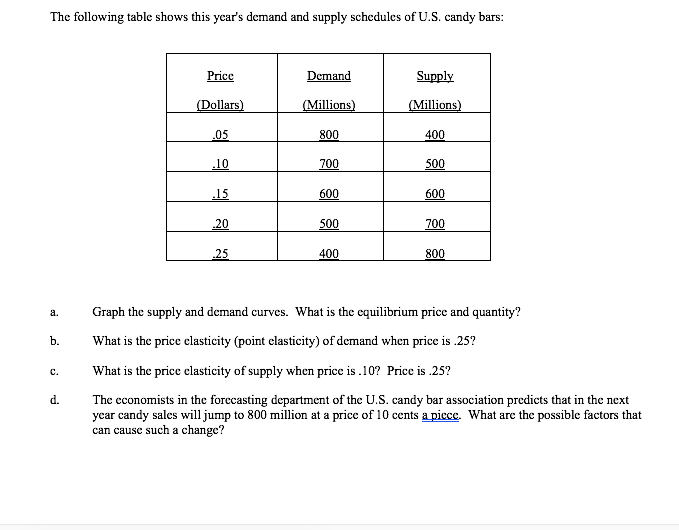
The following table shows this year's demand and supply schedules of U.S. candy bars: Price Demand Supply (Dollars (Millions) (Millions) 05 800 400 .10 700 500 .15 600 600 20 500 700 25 400 800 a. Graph the supply and demand curves. What is the equilibrium price and quantity? b. What is the price clasticity (point elasticity) of demand when price is .25? C. What is the price clasticity of supply when price is .10? Price is .25? d. The economists in the forecasting department of the U.S. candy bar association predicts that in the next year candy sales will jump to 800 million at a price of 10 cents a piece. What are the possible factors that can cause such a change
Step by Step Solution
There are 3 Steps involved in it

Get step-by-step solutions from verified subject matter experts