

Question: I am not sure how to solve this. Solar Panel Power Output The graph of the function f shown in the accompanying figure gives the
I am not sure how to solve this.
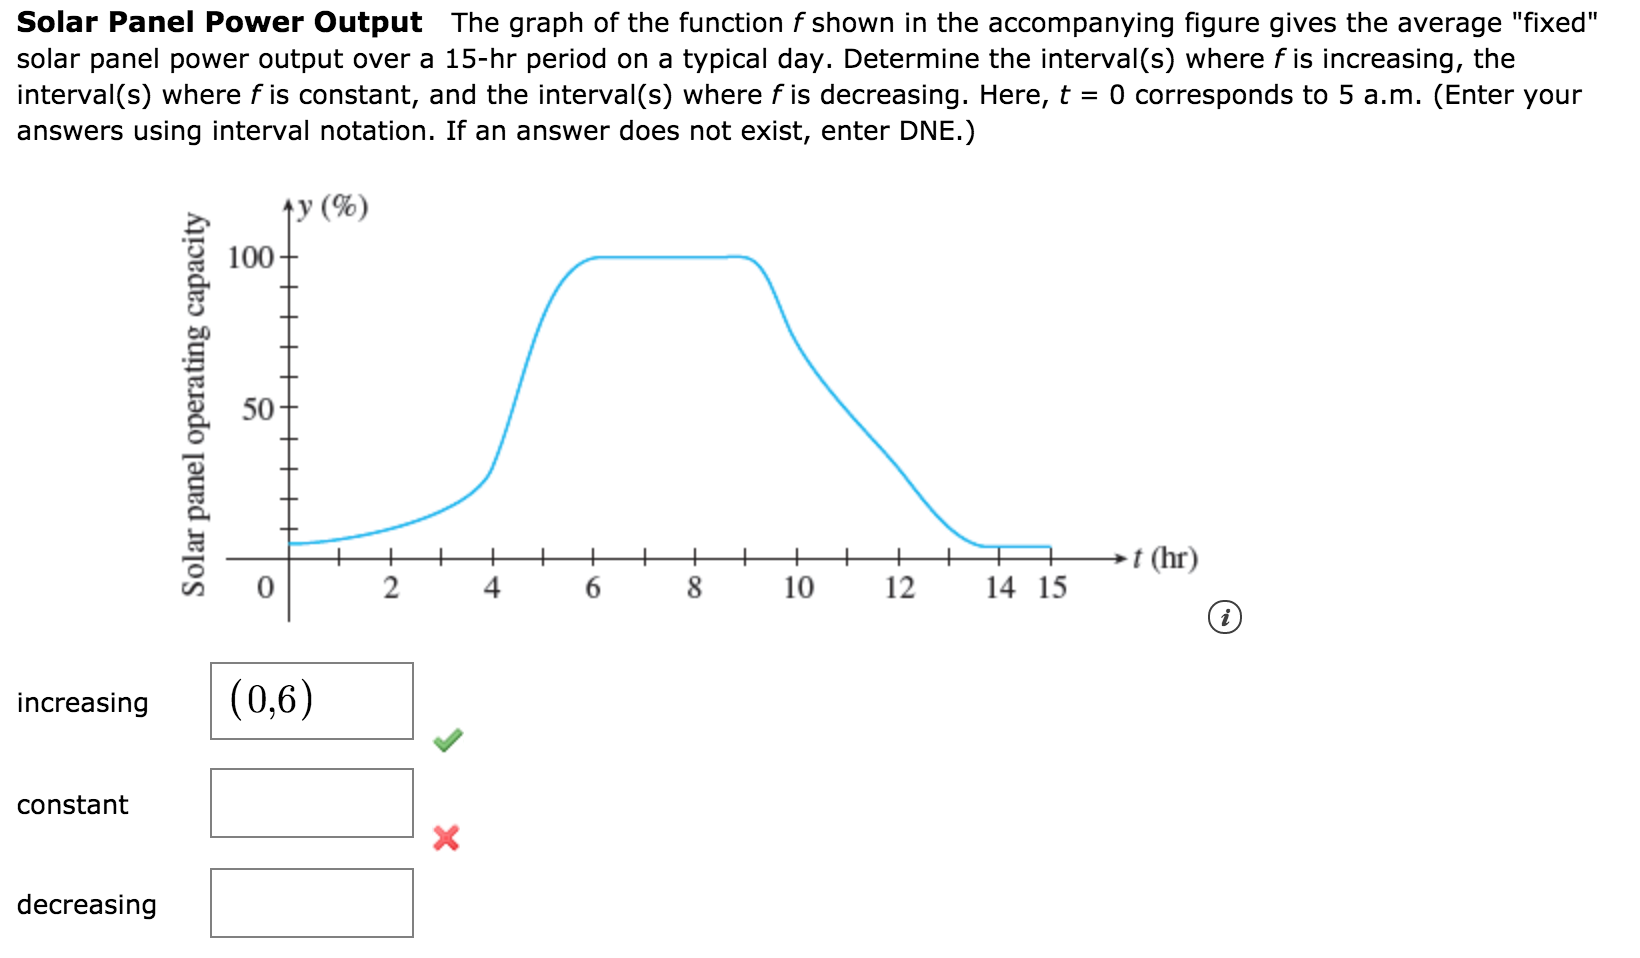
Solar Panel Power Output The graph of the function f shown in the accompanying figure gives the average "fixed" solar panel power output over a 15-hr period on a typical day. Determine the interval(s) where f is increasing, the interval(s) where f is constant, and the interval(s) where f is decreasing. Here, t = 0 corresponds to 5 a.m. (Enter your answers using interval notation. If an answer does not exist, enter DNE.) Solar panel operating capacity ty (6 ) 100+ 50- t (hr) 0 6 8 10 12 14 15 i increasing (0,6) constant X decreasing
Step by Step Solution
There are 3 Steps involved in it
1 Expert Approved Answer
Step: 1 Unlock

Question Has Been Solved by an Expert!
Get step-by-step solutions from verified subject matter experts
Step: 2 Unlock
Step: 3 Unlock