

Question: I am stumped after the first part. I need help. based on this chart, I need to find the slope means that the consumption of
I am stumped after the first part. I need help. based on this chart, I need to find the slope means that the consumption of wind energy in the country increased by how many trillion BTU per year? I also need to use (0, 55) and (4, 129) to find a linear equation relating to the consumption of wind energy y to the number of years X since 2000. Finally, I need to learn how, if the linear trend continues to be on the observed data values, what equation from the above question would estimate the consumption of wind energy in year 2009. How many trillion BTUs would that be?Can you please show me step-by-step, how to resolve these equations?
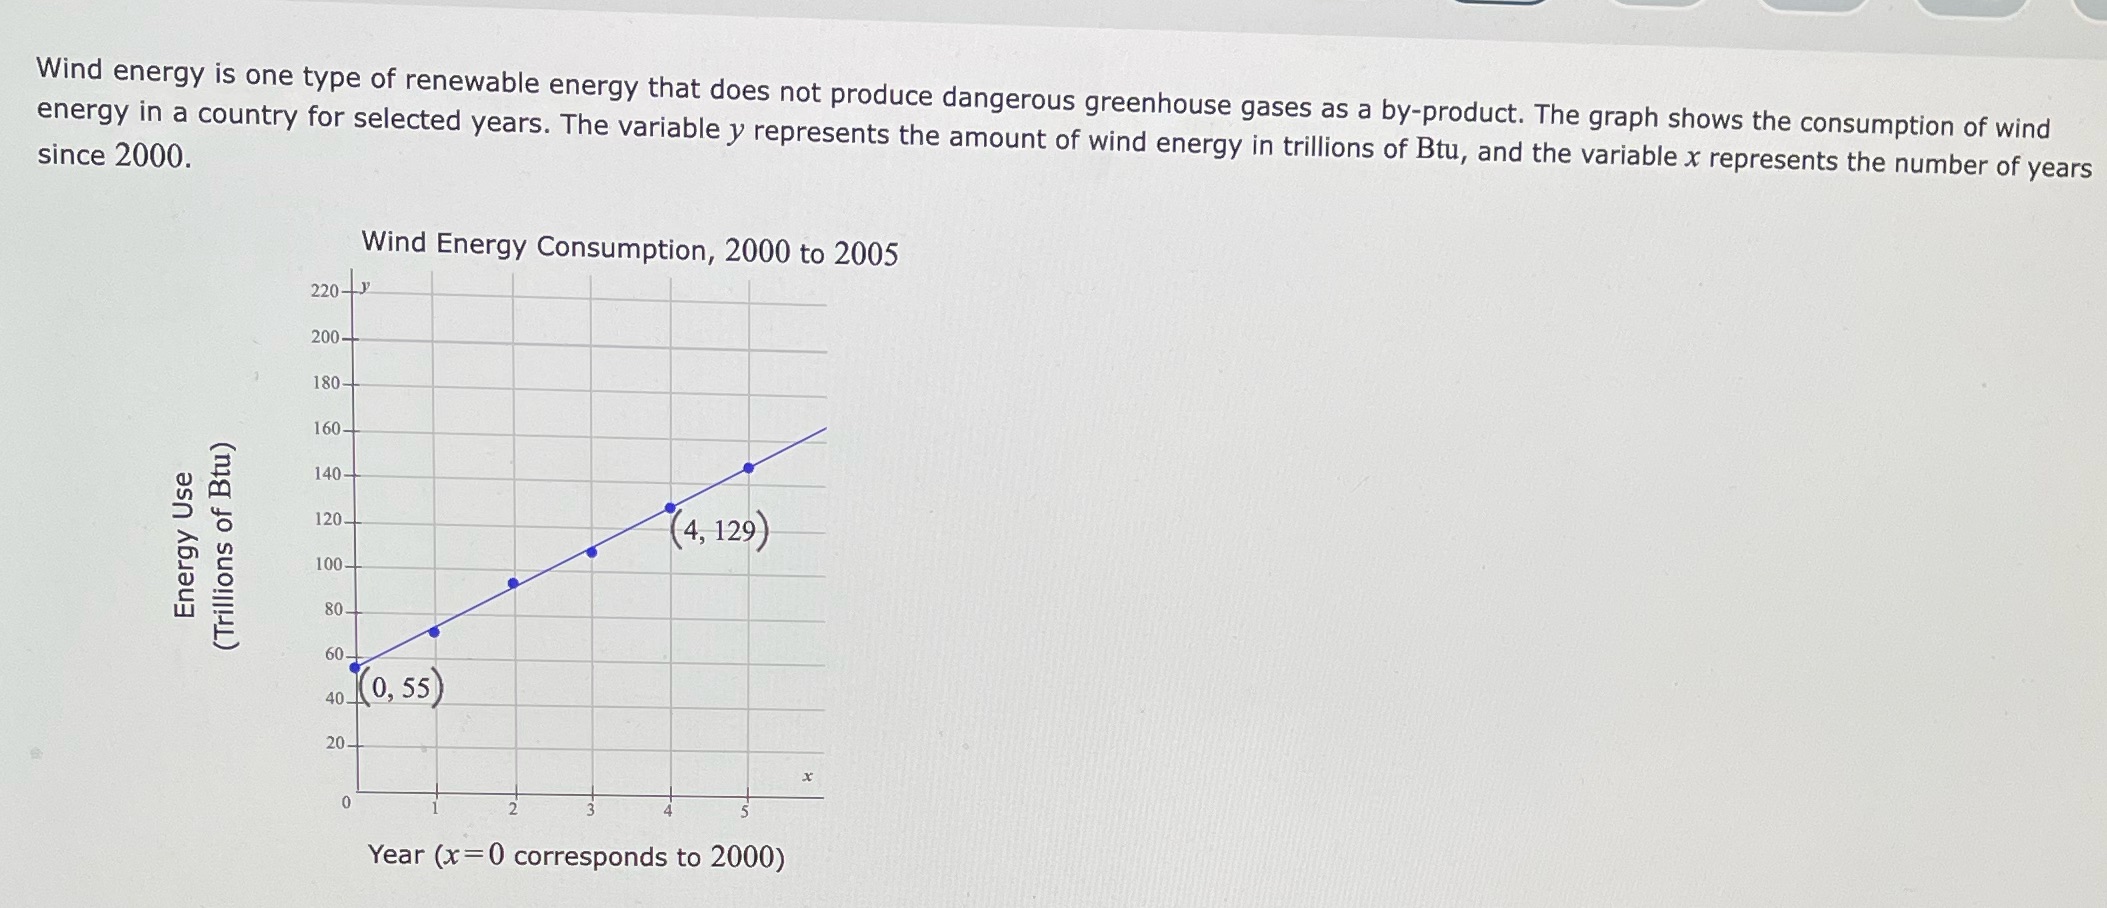
Wind energy is one type of renewable energy that does not produce dangerous greenhouse gases as a by-product. The graph shows the consumption of wind energy in a country for selected years. The variable y represents the amount of wind energy in trillions of Btu, and the variable x represents the number of years since 2000. Wind Energy Consumption, 2000 to 2005 200- 180- 160- 140- 120- ( 4, 129 ) (Trillions of Btu) Energy Use 100- 80 60- 40 - 10, 55) 20- Year (x=0 corresponds to 2000)
Step by Step Solution
There are 3 Steps involved in it

Get step-by-step solutions from verified subject matter experts