

Question: I am stumped on this test question Edit View Go Tools Window Help app.schoology.com AutoSave OOFF ~ ~ 5 > > Chapter_7_Test.pdf (page 2 of
I am stumped on this test question
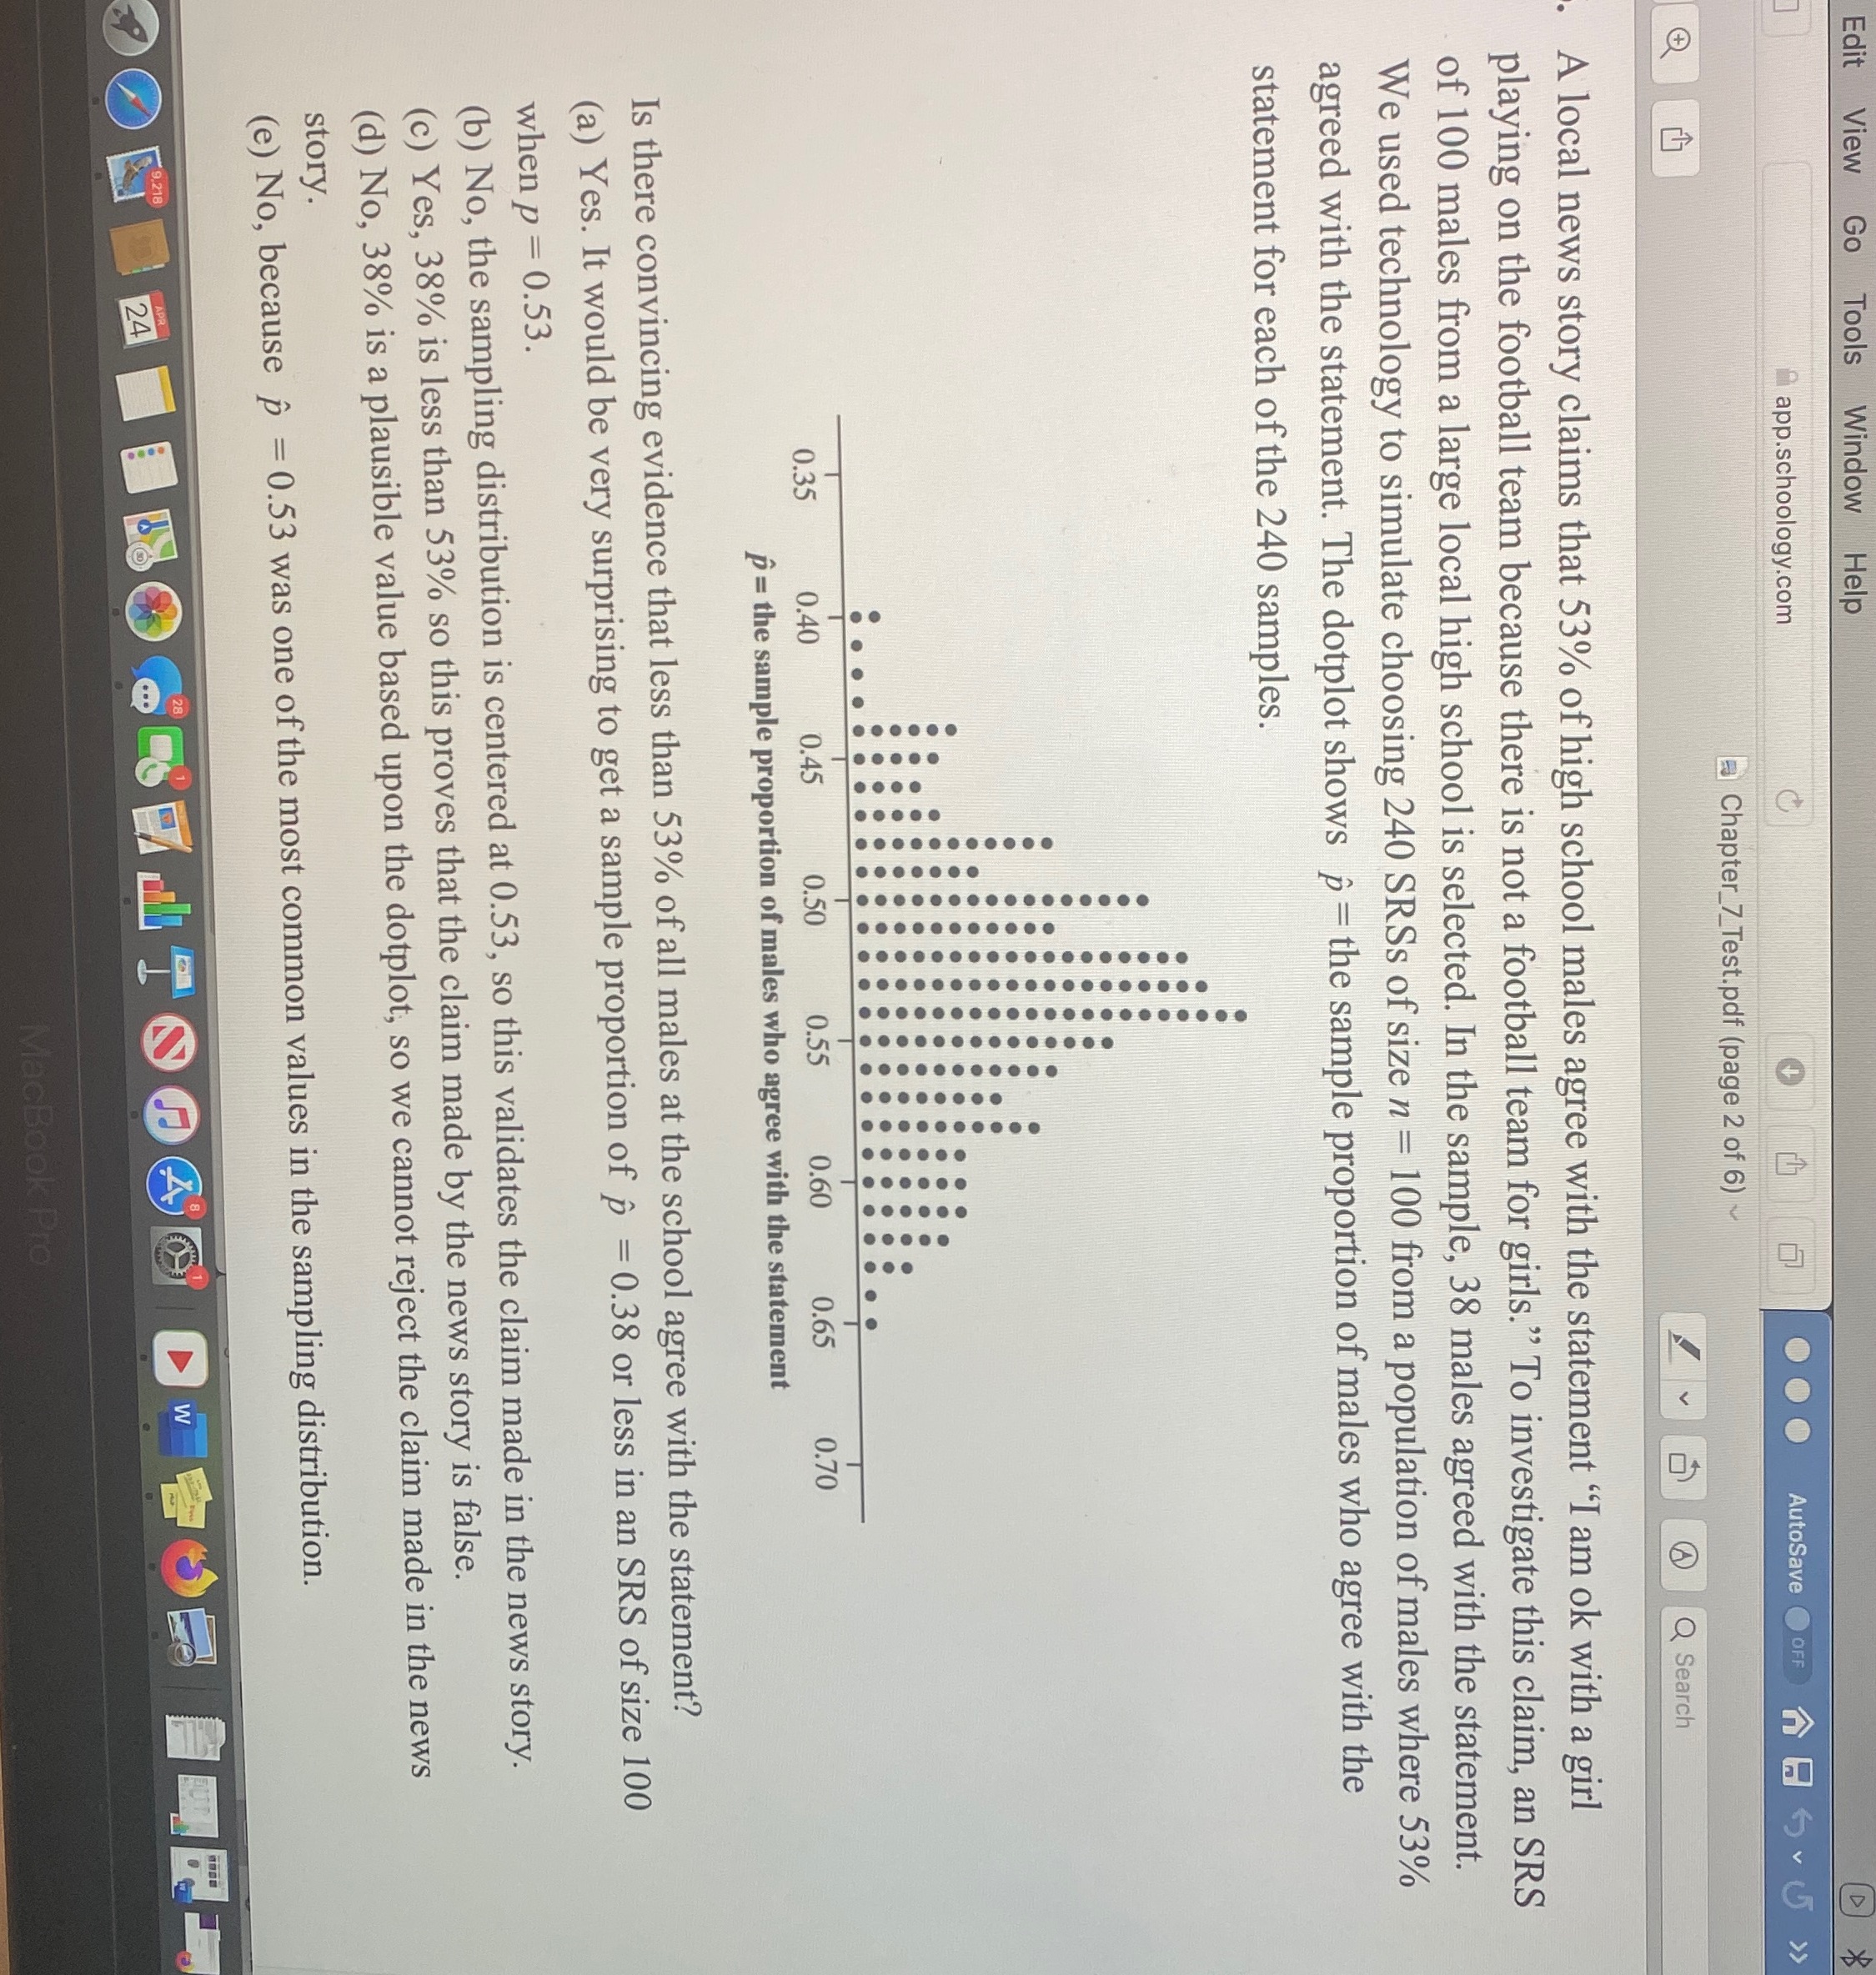
Edit View Go Tools Window Help app.schoology.com AutoSave OOFF ~ ~ 5 > > Chapter_7_Test.pdf (page 2 of 6)~ J V Q Q Search A local news story claims that 53% of high school males agree with the statement "I am ok with a girl playing on the football team because there is not a football team for girls." To investigate this claim, an SRS of 100 males from a large local high school is selected. In the sample, 38 males agreed with the statement. We used technology to simulate choosing 240 SRSs of size n = 100 from a population of males where 53% agreed with the statement. The dotplot shows = the sample proportion of males who agree with the statement for each of the 240 samples. . . . .. . . . .... ... . . .. ........ .. . ............. ....... ......... . .... ....... .. . .. . ... ........... .. ......... .... . .. . . . . ... . .. . ... .. .. . . . . .. . .. . . . . . . . . . . . 0.35 0.40 0.45 0.50 in 0.60 0.65 0.70 p = the sample proportion of males who agree with the statement Is there convincing evidence that less than 53% of all males at the school agree with the statement? (a) Yes. It would be very surprising to get a sample proportion of p = 0.38 or less in an SRS of size 100 when p = 0.53. (b) No, the sampling distribution is centered at 0.53, so this validates the claim made in the news story. (c) Yes, 38% is less than 53% so this proves that the claim made by the news story is false. (d) No, 38% is a plausible value based upon the dotplot, so we cannot reject the claim made in the news story. (e) No, because p = 0.53 was one of the most common values in the sampling distribution. 24 Pro
Step by Step Solution
There are 3 Steps involved in it

Get step-by-step solutions from verified subject matter experts