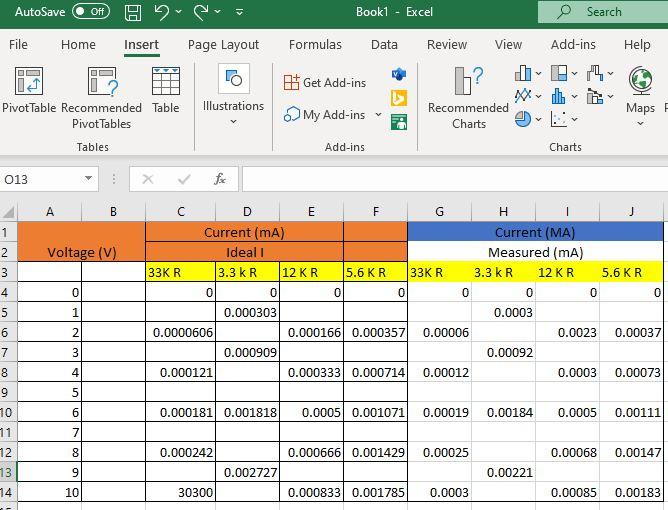
Question: I am trying to create a excel scattered plot chart where i want the x axis to be volts and i want the y axis

I am trying to create a excel scattered plot chart where i want the x axis to be volts and i want the y axis to be both ideal current and measured current. can someone help me create a excel graph?

I am trying to create a excel scattered plot

AutoSave Off Book 1 - Excel O Search File Home Insert Page Layout Formulas Data Review View Add-ins Help y Get Add-ins My Add-ins Illustrations Pivot Table Recommended Table Pivot Tables Recommended Charts Maps v v Tables Add-ins Charts 013 A B Voltage (V) 1 2 3 4 5 6 7 0 D E F G H Current (mA) Current (MA) Ideal Measured (mA) 33KR 3.3 KR 12 KR 5.6 KR 33KR 3.3 KR 12 KR 5.6 KR 0 0 0 0 0 0 0 0 0.000303 0.0003 0.0000606 0.000166 0.000357 0.00006 0.0023 0.00037 0.000909 0.00092 0.000121 0.000333 0.000714 0.00012 0.0003 0.00073 1 2 3 8 4 5 6 0.000181 0.001818 0.0005 0.001071 0.00019 0.00184 0.0005 0.00111 7 9 10 11 72 13 74 8 0.000242 0.00025 0.00068 0.001471 0.000666 0.001429 0.002727) 0.000833 0.001785 9 10 0.00221 30300 0.0003 0.00085 0.00183

Step by Step Solution

There are 3 Steps involved in it

1 Expert Approved Answer
Step: 1 Unlock blur-text-image
Question Has Been Solved by an Expert!

Get step-by-step solutions from verified subject matter experts

Step: 2 Unlock
Step: 3 Unlock

Students Have Also Explored These Related General Management Questions!