

Question: I am trying to create a Tableau visualization to answer the following questions: 1 . How does the sales volume in each store relate
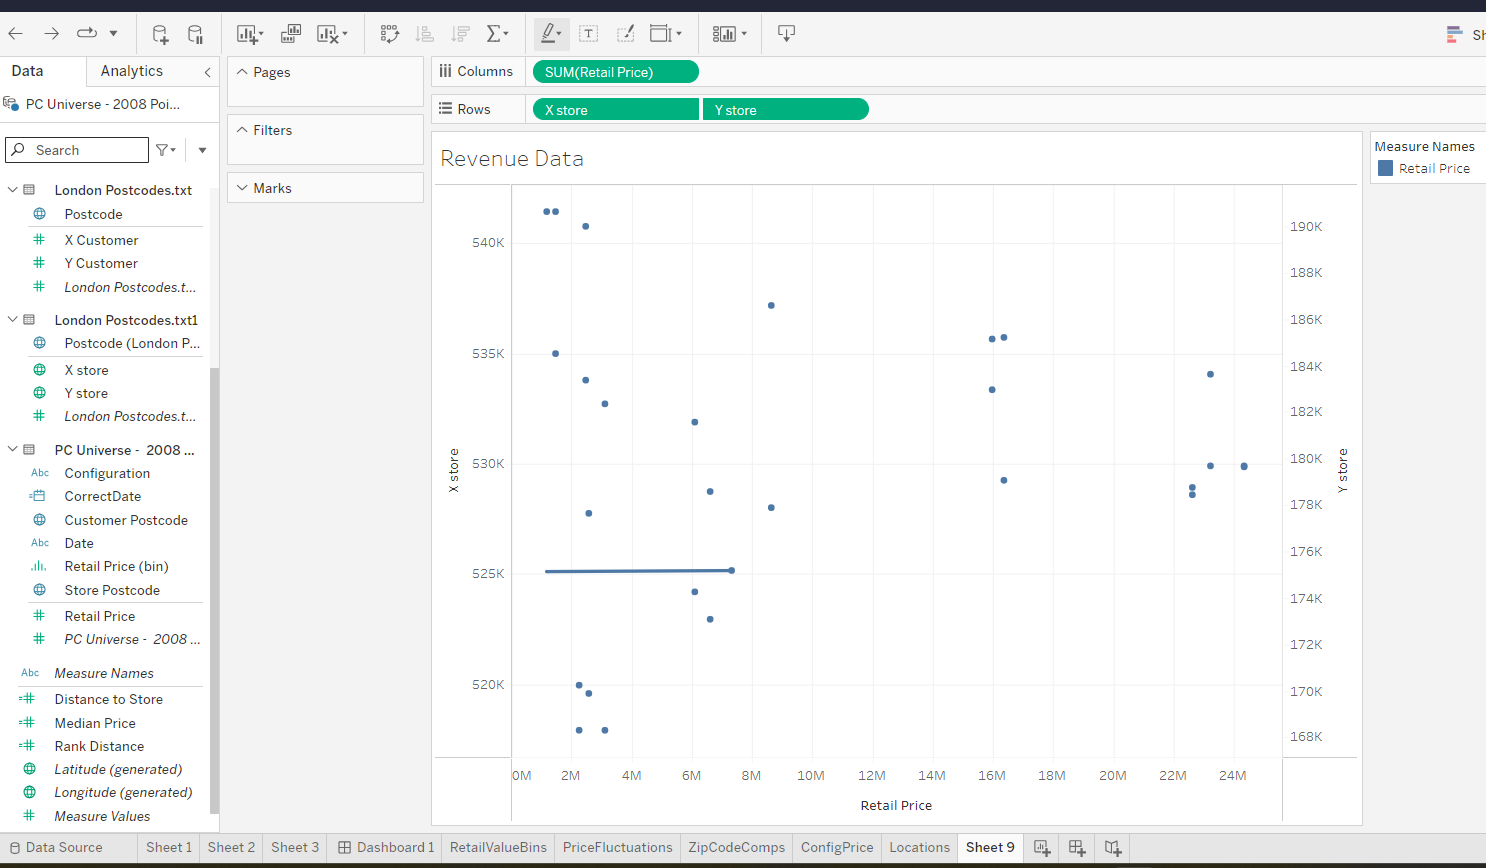
I am trying to create a Tableau visualization to answer the following questions: How does the sales volume in each store relate to revenues?
Tip: to discuss revenue, you can use the sum of the sales ie Sum Retail Price
How does this depend on the configuration?" The uploaded png file is what I've come up with but it seems to be inadequate to answer such questions. Can you help me optimize it
Step by Step Solution
There are 3 Steps involved in it
1 Expert Approved Answer
Step: 1 Unlock

Question Has Been Solved by an Expert!
Get step-by-step solutions from verified subject matter experts
Step: 2 Unlock
Step: 3 Unlock