

Question: To prepare for this case-and those in subsequent chapters-using Tableau, you will need to download Tableau to your Page 43 computer. Tableau provides free instructor
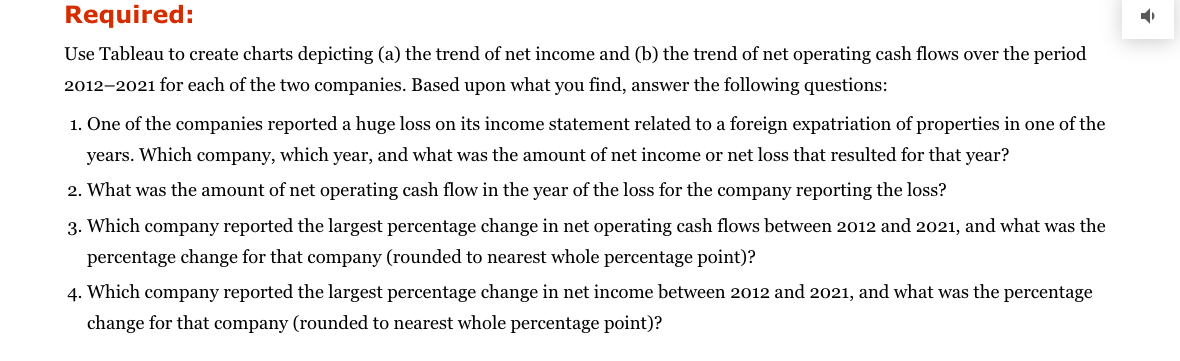
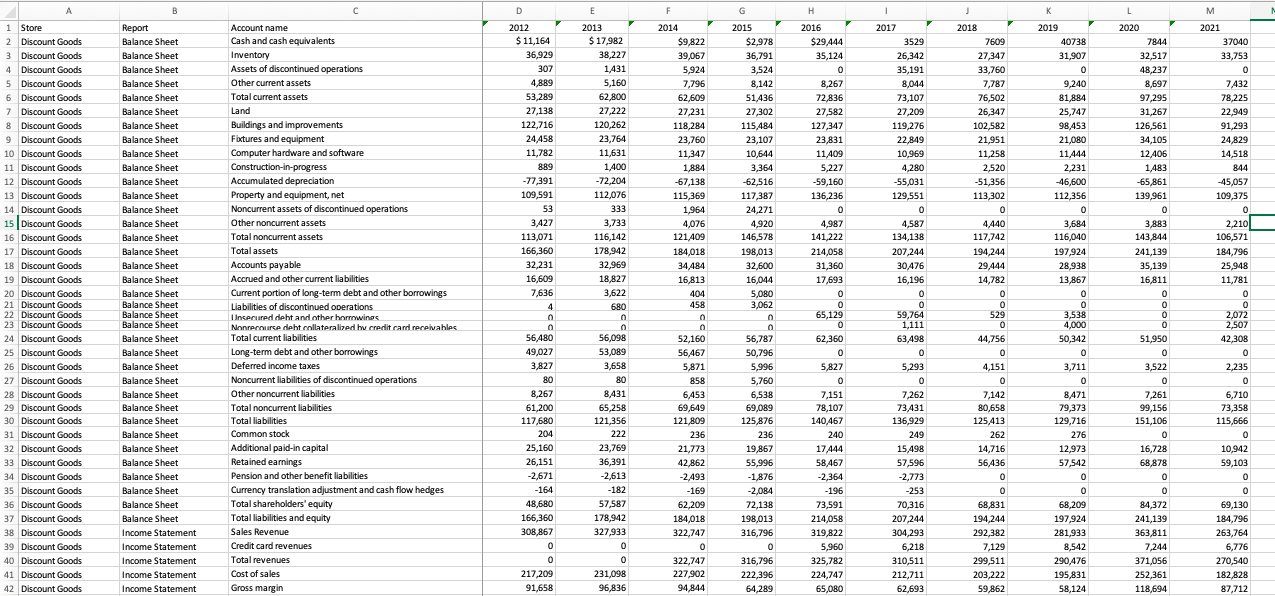
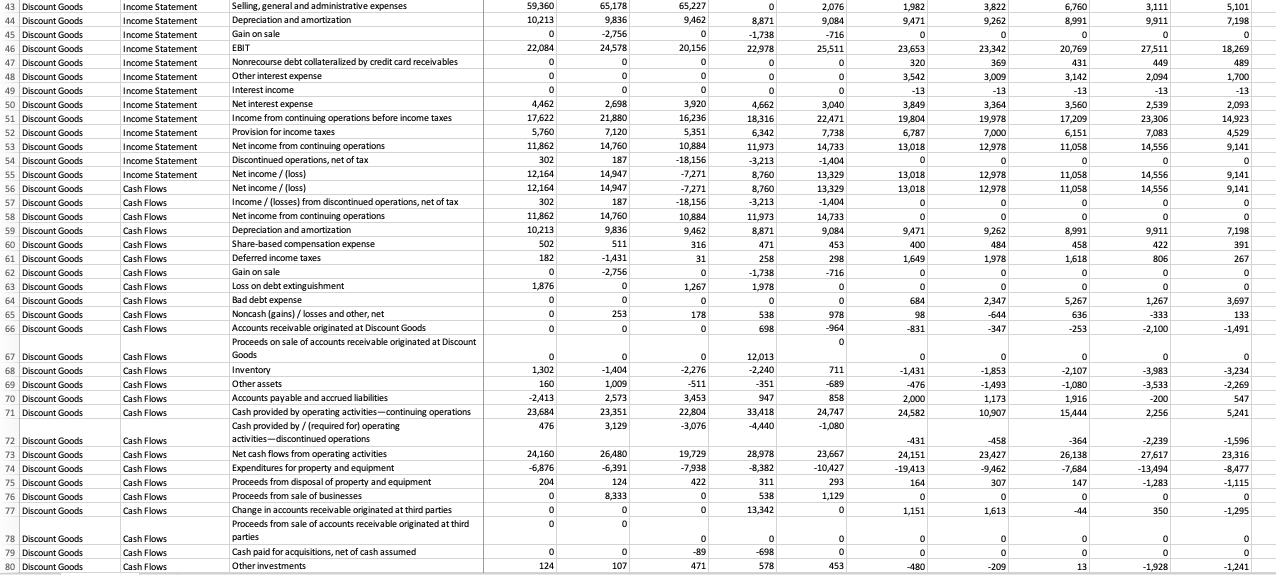
To prepare for this case-and those in subsequent chapters-using Tableau, you will need to download Tableau to your Page 43 computer. Tableau provides free instructor and student licenses as well as free videos and support for utilizing and learning the software. You will receive further information on setting up Tableau from your instructor. Once you are set up with Tableau, watch the three Getting Started Tableau videos. Future cases will build off what you learn in these videos, and additional videos will be suggested. All short training videos can be found at www.tableau.com/learn/training#getting-started. Data Analytics Case Net Income and Cash Flows QL01-2 This case introduces you to data analysis in a very basic way by allowing you to quickly extract, visualize, and compare financial data over a span of ten years for two (hypothetical) publicly traded companies: Discount Goods and Big Store. For this case, assume you are an analyst conducting introductory research into the relative merits of investing in these companies. For this initial look, you want to visualize the pattern of net income and of net operating cash flows over the past ten years for the two companies. Required: Use Tableau to create charts depicting (a) the trend of net income and (b) the trend of net operating cash flows over the period 20122021 for each of the two companies. Based upon what you find, answer the following questions: 1. One of the companies reported a huge loss on its income statement related to a foreign expatriation of properties in one of the years. Which company, which year, and what was the amount of net income or net loss that resulted for that year? 2. What was the amount of net operating cash flow in the year of the loss for the company reporting the loss? 3. Which company reported the largest percentage change in net operating cash flows between 2012 and 2021, and what was the percentage change for that company (rounded to nearest whole percentage point)? 4. Which company reported the largest percentage change in net income between 2012 and 2021, and what was the percentage change for that company (rounded to nearest whole percentage point)? A B D E F H 1 L M 2014 2019 1 Store 2 Discount Goods 3 Discount Goods 4 Discount Goods 5 Discount Goods 6 Discount Goods 7 Discount Goods 8 Discount Goods 9 Discount Goods 10 Discount Goods 11 Discount Goods 12 Discount Goods 13 Discount Goods 14 Discount Goods 15 Discount Goods 16 Discount Goods 17 Discount Goods 18 Discount Goods 19 Discount Goods 20 Discount Goods 21 Discount Goods 22 Discount Goods 23 Discount Goods 24 Discount Goods 25 Discount Goods 26 Discount Goods 27 Discount Goods 28 Discount Goods 29 Discount Goods 30 Discount Goods 31 Discount Goods 32 Discount Goods 33 Discount Goods 34 Discount Goods 35 Discount Goods 36 Discount Goods 37 Discount Goods 38 Discount Goods 39 Discount Goods 40 Discount Goods 41 Discount Goods 42 Discount Goods Report Balance Sheet Balance Sheet Balance Sheet Balance Sheet Balance Sheet Balance Sheet Balance Sheet Balance Sheet Balance Sheet Balance Sheet Balance Sheet Balance Sheet Balance Sheet Balance Sheet Balance Sheet Balance Sheet Balance Sheet Balance Sheet Balance Sheet Balance Sheet Balance Sheet Balance Sheet Balance Sheet Balance Sheet Balance Sheet Balance Sheet Balance Sheet Balance Sheet Balance Sheet Balance Sheet Balance Sheet Balance Sheet Balance Sheet Balance Sheet Balance Sheet Balance Sheet Income Statement Income Statement Income Statement Income Statement Income Statement Account name Cash and cash equivalents Inventory Assets of discontinued operations Other current assets Total current assets Land Buildings and improvements Fixtures and equipment Computer hardware and software Construction-in-progress Accumulated depreciation Property and equipment, net Noncurrent assets of discontinued operations Other noncurrent assets Total noncurrent assets Total assets Accounts payable Accrued and other current liabilities Current portion of long-term debt and other borrowings Liabilities of discontinued operations Unsecured debt and other borrowines Nonrecourse debt collateralized by credit card receivables Total current liabilities Long-term debt and other borrowings Deferred income taxes Noncurrent liabilities of discontinued operations Other noncurrent liabilities Total noncurrent liabilities Total liabilities Common stock Additional paid-in capital Retained earning Pension and other benefit liabilities Currency translation adjustment and cash flow hedges Total shareholders' equity ' Total liabilities and equity Sales Revenue Credit card revenues Total revenues Cost of sales Gross margin 2012 $ 11,164 36,929 307 4,889 53,289 27,138 122,716 24,458 11,782 889 -77,391 109,591 53 3,427 113,071 166,360 32,231 16,609 7,636 4 2013 $ 17,982 38,227 1431 5,160 62,800 27,222 120,262 23,764 11,631 1,400 -72,204 112,076 333 3,733 116,142 178,942 32,969 18,827 3,622 680 2020 7844 32,517 48,237 8,697 97,295 31,267 126,561 34,105 12,406 1,483 -65,861 139,961 $9,822 39,067 5,924 7,796 62,609 27,231 118,284 23,760 11,347 1,884 -67,138 115,369 1,964 4,076 121,409 184,018 34,484 16,813 404 458 0 2015 $2,978 36,791 3,524 8.142 51,436 27,302 115,484 23,107 10,644 3,364 -62,516 117 387 24,271 4,920 146,578 198,013 32,600 16,044 5,080 3,062 2016 $29,444 35,124 0 8,267 72,836 27,582 127,347 23,831 11,409 5,227 -59,160 136,236 0 4,987 141,222 214,058 31,360 17,693 0 0 65,129 0 62,360 0 5,827 0 7,151 78,107 140,467 240 17,444 58,467 -2,364 -196 73,591 214,058 319,822 5,960 325,782 224,747 65,080 2017 3529 26,342 35,191 8,044 73,107 27,209 119,276 22,849 10,969 4,280 -55,031 129,551 0 0 4,587 134,138 207,244 30,476 16,196 0 0 59,764 1,111 63,498 0 5,293 0 7,262 73,431 136,929 249 15,498 57,596 -2,773 -253 70,316 207,244 304,293 6,218 310,511 212,711 62,693 2018 7609 27,347 33,760 7,787 76,502 26,347 102,582 21,951 11,258 2,520 -51,356 113,302 0 4,440 117,742 194,244 29,444 14,782 0 0 529 0 44,756 0 4,151 40738 31,907 0 9,240 81,884 25,747 98,453 21,080 11,444 2,231 -46,600 112,356 0 3,684 116,040 197,924 28,938 13,867 0 0 0 3,538 4,000 50,342 0 3,711 0 8,471 79,373 129,716 276 12,973 57,542 0 0 68,209 197,924 281,933 8,542 290,476 195,831 58,124 0 3,883 143,844 241,139 35,139 16,811 0 0 0 0 0 51,950 2021 37040 33,753 0 7,432 78,225 22,949 91,293 24,829 14,518 844 -45,057 109,375 0 2,210 106,571 184,796 25,948 11,781 0 0 2,072 2,507 42,308 0 2,235 0 6,710 73,358 115,666 0 10,942 59,103 0 0 69,130 184,796 263,764 6,776 270,540 182,828 87,712 0 0 56,480 49,027 3,827 80 8,267 61,200 117,680 204 25,160 26,151 -2,671 -164 48,680 166,360 308,867 0 0 217,209 91,658 56,098 53,089 3,658 80 8,431 65,258 121,356 222 23,769 36,391 -2,613 -182 57,587 178,942 327,933 0 0 231,098 96,836 52,160 56,467 5,871 858 6,453 69,649 121,809 236 21,773 42,862 -2,493 -169 62,209 184,018 322,747 0 322,747 227,902 94,844 0 56,787 50,796 5,996 5,760 6,538 69,089 125,876 236 19,867 55,996 -1,876 -2,084 72,138 198,013 316,796 0 316,796 222,396 64,289 7,142 80,658 125,413 262 14,716 56,436 0 3,522 0 o 7,261 99,156 151,106 0 16,728 68,878 0 0 84,372 241,139 363,811 7,244 371,056 252,361 118,694 0 68,831 194,244 292,382 7,129 299,511 203,222 59,862 is 4,5 2.698 21,880 7,120 19,804 come statemen Income Statement 1 1216 12.164 3,920 16,236 5,35 10,50 -7.271 -271 -18,156 10,884 9.46. 9.141 9,141 13.018 11.058 12 12330 -1,404 14,733 8,760 -3,213 11.973 187 14,760 8991 11862 10,213 502 182 1876 458 Cash Flows Cash Flow Cash Flow Cash Flow Cash Flow cach Cash Flows Cash Flows Cash Flow 422 253 5,267 636 253 538 GOR 0 -333 -2,100 0 o 12,013 -2,240 68 Discount 70 Pieronta Cash Flow Cash Flows Cash Flowe Cash Flows 241 2578 23.35 3.45 22804 22.10 4440 Cash Flow 28,978 -3,582 -364 26,138 7,684 -19,413 -2,239 27,617 13494 1,285 73 Discount Goods 74 Discount Goods 75 Discount Goods count.com 422 13,342 -1.295 Discount Goods 79 Discount Goods Cash paid for acquisitions, net of cash assumed Other investments 109 WOO -6,547 2,173 -7,133 5,689 -8,551 81 Discount Goods Cash Flows 0 0 0 0 0 0 84 -1,427 -6,893 -4,138 0 0 2.258 0 0 -7,751 0 0 -7,569 0 -12,128 0 0 0 0 0 0 -6,547 0 0 8,787 -11,738 -5,991 -16,471 982 -24,431 0 0 -6,818 17,982 11,164 6,867 5,835 43,046 1,941 0 -8,756 -2,204 -1,880 209 0 0 4,493 -10,040 -2,707 -10,898 1,307 0 -17,844 0 -378 -6,053 -15,480 1,333 -20,578 0 0 0 8,160 9,822 17,982 8,705 5,624 44,469 1,441 Cash (required for) / provided by investing activities-continuing operations Cash provided by / (required for) investing activities-discontinued operations Net cash flows from investing activities Change in commercial paper, net Reductions/Additions of short-term debt Additions to long-term debt Reductions of long-term debt Dividends paid Repurchase of stock Stock option exercises Other Net cash flows from financing activities Effect of exchange rate changes on cash and cash equivalents Net (decrease) / increase in cash and cash equivalents Cash & cash equivalents, beginning of year Cash & cash equivalents, end of year Cash and cash equivalents Receivables, net Inventories Prepaid expenses and other Current assets of discontinued operations Total current assets Property and equipment Less accumulated depreciation Property and equipment, net Property under capital lease and financing obligations Less accumulated amortization Property under capital lease and financing obligations, net Goodwill Other assets and deferred charges Total noncurrent assets Total assets Short-term borrowings Accounts payable Accrued liabilities Accrued income taxes Current portion of long-term debt and other borrowings Current liabilities of discontinued operations Total current liabilities 0 -18,578 0 6,667 8,862 -13,889 -3,333 -8,187 396 -27 -9,511 -142 -4,080 7,609 3,529 6,550 5,937 40,714 1,774 -12,689 4,311 -6,667 8,760 -6,796 -3,862 -8,333 1,600 -71 -11,058 36 -44 3,529 3,484 7,781 6,768 43,803 1,588 0 82 Discount Goods 83 Discount Goods 84 Discount Goods 85 Discount Goods 86 Discount Goods 87 Discount Goods 88 Discount Goods 89 Discount Goods 90 Discount Goods 91 Discount Goods 92 Discount Goods 93 Discount Goods 94 Discount Goods 95 Discount Goods 96 Discount Goods 97 Big Store 98 Big Store 99 Big Store 100 Big Store 101 Big Store 102 Big Store 103 Big Store 104 Big Store 105 Big Store 106 Big Store 107 Big Store 108 Big Store 109 Big Store 110 Big Store 111 Big Store 112 Big Store 113 Big Store 114 Big Store 115 Big Store 116 Big Store 117 Big Store 118 Big Store 119 Big Store Cash Flows Cash Flows Cash Flows Cash Flows Cash Flows Cash Flows Cash Flows Cash Flows Cash Flows Cash Flows Cash Flows Cash Flows Cash Flows Cash Flows Cash Flows Balance Sheet Balance Sheet Balance Sheet Balance Sheet Balance Sheet Balance Sheet Balance Sheet Balance Sheet Balance Sheet Balance Sheet Balance Sheet Balance Sheet Balance Sheet Balance Sheet Balance Sheet Balance Sheet Balance Sheet Balance Sheet Balance Sheet Balance Sheet Balance Sheet Balance Sheet Balance Sheet -8,560 -356 0 0 8.858 -9,240 -5,356 0 1,658 0 4,436 0 6,733 3,089 9,822 9,135 6,778 45,141 2,224 0 63,278 177,395 -63,115 114,280 5,239 -2,864 2,375 18,102 5,671 140,428 203,706 1,592 38,410 19,152 1,021 5,375 -1,204 -3,956 0 0 -15.391 -4,471 -6,493 2,027 0 -28,284 116 -396 3,484 3,089 7,281 6,677 44,858 1,909 460 61,185 173,089 -57,725 115,364 5,589 -3,046 2,543 19,510 6,149 143,566 204,751 7,670 37415 18,793 966 4,668 57,689 179,492 -71,782 107,710 11,637 -5,169 6,468 17,037 9,921 141,136 198,825 1,099 41,433 20,654 921 2,821 0 -16,356 0 0 3,950 -14,217 -5,050 -15,289 -33 0 0 -30,639 0 -19,378 10,556 -8,822 8,869 5,986 46,523 3,325 -211 64,491 185,730 -54,733 130,998 7,008 -4,281 3,100 19,353 4,786 160,963 225 454 914 41,571 24,316 -179 6,009 99 72,730 60,239 176,958 -66,787 110,171 11,096 -4,751 6,345 16,695 6,131 139,342 199,581 2,708 38,487 19,607 521 3,310 59,940 165,825 -51,896 113,929 5,899 -3,147 2,752 20,497 5,987 143,165 203,105 6,805 38,080 18,808 2,211 6,152 -2,169 9,778 7,609 7,395 5,089 36,318 2,960 131 51,893 148,584 -43,486 105,098 5,905 -3,125 2,780 16,763 4,129 128,770 180,663 1,031 33,557 18,701 157 5,220 47 58,484 54,975 155,002 -45,399 109,603 5,936 -3,215 2,721 20,651 5,456 138,431 193,406 4,047 36,608 18,180 1,164 2,540 0 62,300 -12,631 0 5,938 3,840 9,778 7,907 4,144 32,713 3,128 140 48,032 137,848 -38,304 99,544 5,669 -2.906 2,763 16,126 3,942 122,375 170,407 523 30,451 18,734 1,347 4,615 92 55,543 -9,484 -3,326 -3,021 -1,057 0 -13,127 0 -1,938 2,356 418 7,151 3,613 32,724 2,658 -150 45,996 129,295 -36,288 93,007 5,047 -3,014 2,315 14,876 3,423 113,905 159,901 210 28,342 18,200 984 4,090 102 51,928 0 65,272 89 69,345 64,619 0 71,818 66,928 120 Big Store 121 Big Store 122 Big Store 123 Big Store 124 Big Store 125 Big Store 126 Big Store 127 Big Store 128 Big Store 129 Big Store 130 Big Store 131 Big Store 132 Big Store 133 Big Store 134 Big Store 135 Big Store 136 Big Store 137 Big Store 138 Big Store 139 Big Store 140 Big Store 141 Big Store 142 Big Store 143 Big Store 144 Big Store 145 Big Store Balance Sheet Balance Sheet Balance Sheet Balance Sheet Balance Sheet Balance Sheet Balance Sheet Balance Sheet Balance Sheet Balance Sheet Balance Sheet Income Statement Income Statement Income Statement Income Statement Income Statement Income Statement Income Statement Income Statement Income Statement Income Statement Income Statement Income Statement Income Statement Income Statement Income Statement Long-term debt Long-term capital lease and financing obligations Deferred income taxes and other Total noncurrent liabilities Total liabilities Common stock Capital in excess of par value Retained earnings Accumulated other comprehensive loss Total shareholders' equity Total liabilities and equity Sales revenue Credit card revenues Total revenues Cost of sales Gross margin Selling, general and administrative expenses Operating income Debt Capital lease and financing obligations EBIT Provision for income taxes Income from continuing operations Income from discontinued operations, net of income taxes Interest income Net income / loss) Consolidated net income attributable to noncontrolling interest 38,214 5,816 7,321 51,351 115,970 317 5,436 90,021 -11,597 83,611 199,581 478,614 3,516 482,130 360,984 121,146 97,041 24,105 4411 521 19,173 6,558 12,615 0 2,467 15,080 -386 41,086 2,606 8,805 52,497 117,769 323 6,914 85,777 -7,168 85,937 203,706 482,229 3,422 485,651 365,086 120,565 93,418 27,147 4,292 300 22,555 7,985 14,570 285 2,348 17,099 -736 41,771 2,788 9.508 54,067 123,412 323 7,455 76,566 -2,996 81,339 204,751 473,076 3,218 476,294 358,069 118,225 91,353 26,872 4,160 263 22,449 8,105 14,344 144 2,216 16,695 38,394 3,023 8,536 49,953 121,771 332 7,766 72,978 -587 81,738 203,105 465,604 3,047 468,651 352,297 116,354 88,629 27,725 4,007 272 23,446 7,958 15,488 52 2,063 17,756 44,070 3,009 8,421 55,500 117,800 342 6,817 68,691 -1,410 75,761 193406 443,854 3,096 446,950 335,127 111,823 85,265 26,558 4,104 288 22,166 7,944 14,222 -67 2,160 16,387 40,692 3,150 8,425 52,267 110,751 352 5,076 63,967 646 71,247 180,663 418,952 2,897 421,849 314,946 106,903 81,361 25,542 3,948 277 21,317 7,579 13,738 1,034 2,004 16,993 33,231 3,170 8,324 44,725 100,268 378 4,551 66,357 -70 72,648 170,407 405,132 2,953 408,085 304,444 103,641 76,639 24,002 3,828 278 19,896 7,156 12,740 -79 1,884 14,883 50,490 3,563 8,152 62,205 134,935 65 5,377 84,645 433 90,520 225 454 523,315 3,246 526,936 393,308 133,629 101,326 30,955 2,698 8,024 41,677 93,605 73 4,138 62,433 -348 66,296 159,901 380,542 2,494 383,318 285,895 97,423 71,759 22,280 3,433 220 18,627 6,445 12,182 -356 1,489 13,708 31,553 4,074 260 27,219 9,099 18,120 918 2,130 20,866 146 Big Store 147 Big Store 148 Big Store 149 Big Store 150 Big Store 151 Big Store 152 Big Store 153 Big Store 154 Big Store 155 Big Store 156 Big Store 157 Big Store 158 Big Store 159 Big Store Income Statement Income Statement Cash Flows Cash Flows Cash Flows Cash Flows Cash Flows Cash Flows Cash Flows Cash Flows Cash Flows Cash Flows Cash Flows Cash Flows Consolidated net income to corporation Consolidated net income Income from discontinued operations, net of income taxes Income from continuing operations Depreciation and amortization Deferred income taxes Other operating activities Receivables, net Inventories Accounts payable Accrued liabilities Accrued income taxes Net cash flows from operating activities 14,694 15,080 0 15,080 9,454 -672 1,410 -19 -703 2,008 1,303 -472 27,389 16,363 17,099 -285 16,814 9,173 -503 785 -569 -1,229 2,678 1,249 166 28,564 -673 16,022 16,695 -144 16,551 8,870 -279 938 -566 -1,667 531 103 -1,224 23,257 -757 16,999 17,756 -52 17,704 8,478 -133 602 -614 -2,759 1,061 271 981 25,591 -688 15,699 16,387 67 16,454 8,130 1,050 398 -796 -3,727 2,687 -935 994 24,255 -604 16,389 16,993 -1,034 15,959 7,641 651 1,087 -733 -3,205 2,676 -280 -153 23,643 -513 14,370 14,883 79 14,962 7,157 -504 318 -297 2,213 1,052 1,348 0 26,249 -755 20,111 20,866 -1,668 19,199 9,176 439 984 -818 -4,381 2,970 -725 0 26,843 -402 13,226 13,708 -208 13,500 6,446 -756 17 -561 1,798 707 985 -282 21,854 192 11,125 11,125 -6,288 Cash Flows wares Cache Cash Flow Cash Flows Cash Flowe Cash Flow Cash Flow Cash Flow Cash Flow Cash Flow Cash Flows Cash Flow Cash Flows Cash Flows ware Cash Flows Net cash flows from operating activities Payments for property and equipment and equipment sto Purchase of available for sale securities acons Investment and business acquisitions, net of cash acquired Other investing activities Net cash flows from investing activities Net change in short-term borrowings Proceeds from issuance of long-term debt annens of long-term debt Purchase of Company stock Dividends paid to noncontrolling interest Purchase of noncontrolling interest Other financing activities Net cash flows from financing activities Effect of exchange rates on cash and cash equivalents coachecast decrease in cash and cash equivalents Cash & cash equivalents, end of year 185 -1844 -15,071 10,789 Big Store Rig Store 085 To prepare for this case-and those in subsequent chapters-using Tableau, you will need to download Tableau to your Page 43 computer. Tableau provides free instructor and student licenses as well as free videos and support for utilizing and learning the software. You will receive further information on setting up Tableau from your instructor. Once you are set up with Tableau, watch the three Getting Started Tableau videos. Future cases will build off what you learn in these videos, and additional videos will be suggested. All short training videos can be found at www.tableau.com/learn/training#getting-started. Data Analytics Case Net Income and Cash Flows QL01-2 This case introduces you to data analysis in a very basic way by allowing you to quickly extract, visualize, and compare financial data over a span of ten years for two (hypothetical) publicly traded companies: Discount Goods and Big Store. For this case, assume you are an analyst conducting introductory research into the relative merits of investing in these companies. For this initial look, you want to visualize the pattern of net income and of net operating cash flows over the past ten years for the two companies. Required: Use Tableau to create charts depicting (a) the trend of net income and (b) the trend of net operating cash flows over the period 20122021 for each of the two companies. Based upon what you find, answer the following questions: 1. One of the companies reported a huge loss on its income statement related to a foreign expatriation of properties in one of the years. Which company, which year, and what was the amount of net income or net loss that resulted for that year? 2. What was the amount of net operating cash flow in the year of the loss for the company reporting the loss? 3. Which company reported the largest percentage change in net operating cash flows between 2012 and 2021, and what was the percentage change for that company (rounded to nearest whole percentage point)? 4. Which company reported the largest percentage change in net income between 2012 and 2021, and what was the percentage change for that company (rounded to nearest whole percentage point)? A B D E F H 1 L M 2014 2019 1 Store 2 Discount Goods 3 Discount Goods 4 Discount Goods 5 Discount Goods 6 Discount Goods 7 Discount Goods 8 Discount Goods 9 Discount Goods 10 Discount Goods 11 Discount Goods 12 Discount Goods 13 Discount Goods 14 Discount Goods 15 Discount Goods 16 Discount Goods 17 Discount Goods 18 Discount Goods 19 Discount Goods 20 Discount Goods 21 Discount Goods 22 Discount Goods 23 Discount Goods 24 Discount Goods 25 Discount Goods 26 Discount Goods 27 Discount Goods 28 Discount Goods 29 Discount Goods 30 Discount Goods 31 Discount Goods 32 Discount Goods 33 Discount Goods 34 Discount Goods 35 Discount Goods 36 Discount Goods 37 Discount Goods 38 Discount Goods 39 Discount Goods 40 Discount Goods 41 Discount Goods 42 Discount Goods Report Balance Sheet Balance Sheet Balance Sheet Balance Sheet Balance Sheet Balance Sheet Balance Sheet Balance Sheet Balance Sheet Balance Sheet Balance Sheet Balance Sheet Balance Sheet Balance Sheet Balance Sheet Balance Sheet Balance Sheet Balance Sheet Balance Sheet Balance Sheet Balance Sheet Balance Sheet Balance Sheet Balance Sheet Balance Sheet Balance Sheet Balance Sheet Balance Sheet Balance Sheet Balance Sheet Balance Sheet Balance Sheet Balance Sheet Balance Sheet Balance Sheet Balance Sheet Income Statement Income Statement Income Statement Income Statement Income Statement Account name Cash and cash equivalents Inventory Assets of discontinued operations Other current assets Total current assets Land Buildings and improvements Fixtures and equipment Computer hardware and software Construction-in-progress Accumulated depreciation Property and equipment, net Noncurrent assets of discontinued operations Other noncurrent assets Total noncurrent assets Total assets Accounts payable Accrued and other current liabilities Current portion of long-term debt and other borrowings Liabilities of discontinued operations Unsecured debt and other borrowines Nonrecourse debt collateralized by credit card receivables Total current liabilities Long-term debt and other borrowings Deferred income taxes Noncurrent liabilities of discontinued operations Other noncurrent liabilities Total noncurrent liabilities Total liabilities Common stock Additional paid-in capital Retained earning Pension and other benefit liabilities Currency translation adjustment and cash flow hedges Total shareholders' equity ' Total liabilities and equity Sales Revenue Credit card revenues Total revenues Cost of sales Gross margin 2012 $ 11,164 36,929 307 4,889 53,289 27,138 122,716 24,458 11,782 889 -77,391 109,591 53 3,427 113,071 166,360 32,231 16,609 7,636 4 2013 $ 17,982 38,227 1431 5,160 62,800 27,222 120,262 23,764 11,631 1,400 -72,204 112,076 333 3,733 116,142 178,942 32,969 18,827 3,622 680 2020 7844 32,517 48,237 8,697 97,295 31,267 126,561 34,105 12,406 1,483 -65,861 139,961 $9,822 39,067 5,924 7,796 62,609 27,231 118,284 23,760 11,347 1,884 -67,138 115,369 1,964 4,076 121,409 184,018 34,484 16,813 404 458 0 2015 $2,978 36,791 3,524 8.142 51,436 27,302 115,484 23,107 10,644 3,364 -62,516 117 387 24,271 4,920 146,578 198,013 32,600 16,044 5,080 3,062 2016 $29,444 35,124 0 8,267 72,836 27,582 127,347 23,831 11,409 5,227 -59,160 136,236 0 4,987 141,222 214,058 31,360 17,693 0 0 65,129 0 62,360 0 5,827 0 7,151 78,107 140,467 240 17,444 58,467 -2,364 -196 73,591 214,058 319,822 5,960 325,782 224,747 65,080 2017 3529 26,342 35,191 8,044 73,107 27,209 119,276 22,849 10,969 4,280 -55,031 129,551 0 0 4,587 134,138 207,244 30,476 16,196 0 0 59,764 1,111 63,498 0 5,293 0 7,262 73,431 136,929 249 15,498 57,596 -2,773 -253 70,316 207,244 304,293 6,218 310,511 212,711 62,693 2018 7609 27,347 33,760 7,787 76,502 26,347 102,582 21,951 11,258 2,520 -51,356 113,302 0 4,440 117,742 194,244 29,444 14,782 0 0 529 0 44,756 0 4,151 40738 31,907 0 9,240 81,884 25,747 98,453 21,080 11,444 2,231 -46,600 112,356 0 3,684 116,040 197,924 28,938 13,867 0 0 0 3,538 4,000 50,342 0 3,711 0 8,471 79,373 129,716 276 12,973 57,542 0 0 68,209 197,924 281,933 8,542 290,476 195,831 58,124 0 3,883 143,844 241,139 35,139 16,811 0 0 0 0 0 51,950 2021 37040 33,753 0 7,432 78,225 22,949 91,293 24,829 14,518 844 -45,057 109,375 0 2,210 106,571 184,796 25,948 11,781 0 0 2,072 2,507 42,308 0 2,235 0 6,710 73,358 115,666 0 10,942 59,103 0 0 69,130 184,796 263,764 6,776 270,540 182,828 87,712 0 0 56,480 49,027 3,827 80 8,267 61,200 117,680 204 25,160 26,151 -2,671 -164 48,680 166,360 308,867 0 0 217,209 91,658 56,098 53,089 3,658 80 8,431 65,258 121,356 222 23,769 36,391 -2,613 -182 57,587 178,942 327,933 0 0 231,098 96,836 52,160 56,467 5,871 858 6,453 69,649 121,809 236 21,773 42,862 -2,493 -169 62,209 184,018 322,747 0 322,747 227,902 94,844 0 56,787 50,796 5,996 5,760 6,538 69,089 125,876 236 19,867 55,996 -1,876 -2,084 72,138 198,013 316,796 0 316,796 222,396 64,289 7,142 80,658 125,413 262 14,716 56,436 0 3,522 0 o 7,261 99,156 151,106 0 16,728 68,878 0 0 84,372 241,139 363,811 7,244 371,056 252,361 118,694 0 68,831 194,244 292,382 7,129 299,511 203,222 59,862 is 4,5 2.698 21,880 7,120 19,804 come statemen Income Statement 1 1216 12.164 3,920 16,236 5,35 10,50 -7.271 -271 -18,156 10,884 9.46. 9.141 9,141 13.018 11.058 12 12330 -1,404 14,733 8,760 -3,213 11.973 187 14,760 8991 11862 10,213 502 182 1876 458 Cash Flows Cash Flow Cash Flow Cash Flow Cash Flow cach Cash Flows Cash Flows Cash Flow 422 253 5,267 636 253 538 GOR 0 -333 -2,100 0 o 12,013 -2,240 68 Discount 70 Pieronta Cash Flow Cash Flows Cash Flowe Cash Flows 241 2578 23.35 3.45 22804 22.10 4440 Cash Flow 28,978 -3,582 -364 26,138 7,684 -19,413 -2,239 27,617 13494 1,285 73 Discount Goods 74 Discount Goods 75 Discount Goods count.com 422 13,342 -1.295 Discount Goods 79 Discount Goods Cash paid for acquisitions, net of cash assumed Other investments 109 WOO -6,547 2,173 -7,133 5,689 -8,551 81 Discount Goods Cash Flows 0 0 0 0 0 0 84 -1,427 -6,893 -4,138 0 0 2.258 0 0 -7,751 0 0 -7,569 0 -12,128 0 0 0 0 0 0 -6,547 0 0 8,787 -11,738 -5,991 -16,471 982 -24,431 0 0 -6,818 17,982 11,164 6,867 5,835 43,046 1,941 0 -8,756 -2,204 -1,880 209 0 0 4,493 -10,040 -2,707 -10,898 1,307 0 -17,844 0 -378 -6,053 -15,480 1,333 -20,578 0 0 0 8,160 9,822 17,982 8,705 5,624 44,469 1,441 Cash (required for) / provided by investing activities-continuing operations Cash provided by / (required for) investing activities-discontinued operations Net cash flows from investing activities Change in commercial paper, net Reductions/Additions of short-term debt Additions to long-term debt Reductions of long-term debt Dividends paid Repurchase of stock Stock option exercises Other Net cash flows from financing activities Effect of exchange rate changes on cash and cash equivalents Net (decrease) / increase in cash and cash equivalents Cash & cash equivalents, beginning of year Cash & cash equivalents, end of year Cash and cash equivalents Receivables, net Inventories Prepaid expenses and other Current assets of discontinued operations Total current assets Property and equipment Less accumulated depreciation Property and equipment, net Property under capital lease and financing obligations Less accumulated amortization Property under capital lease and financing obligations, net Goodwill Other assets and deferred charges Total noncurrent assets Total assets Short-term borrowings Accounts payable Accrued liabilities Accrued income taxes Current portion of long-term debt and other borrowings Current liabilities of discontinued operations Total current liabilities 0 -18,578 0 6,667 8,862 -13,889 -3,333 -8,187 396 -27 -9,511 -142 -4,080 7,609 3,529 6,550 5,937 40,714 1,774 -12,689 4,311 -6,667 8,760 -6,796 -3,862 -8,333 1,600 -71 -11,058 36 -44 3,529 3,484 7,781 6,768 43,803 1,588 0 82 Discount Goods 83 Discount Goods 84 Discount Goods 85 Discount Goods 86 Discount Goods 87 Discount Goods 88 Discount Goods 89 Discount Goods 90 Discount Goods 91 Discount Goods 92 Discount Goods 93 Discount Goods 94 Discount Goods 95 Discount Goods 96 Discount Goods 97 Big Store 98 Big Store 99 Big Store 100 Big Store 101 Big Store 102 Big Store 103 Big Store 104 Big Store 105 Big Store 106 Big Store 107 Big Store 108 Big Store 109 Big Store 110 Big Store 111 Big Store 112 Big Store 113 Big Store 114 Big Store 115 Big Store 116 Big Store 117 Big Store 118 Big Store 119 Big Store Cash Flows Cash Flows Cash Flows Cash Flows Cash Flows Cash Flows Cash Flows Cash Flows Cash Flows Cash Flows Cash Flows Cash Flows Cash Flows Cash Flows Cash Flows Balance Sheet Balance Sheet Balance Sheet Balance Sheet Balance Sheet Balance Sheet Balance Sheet Balance Sheet Balance Sheet Balance Sheet Balance Sheet Balance Sheet Balance Sheet Balance Sheet Balance Sheet Balance Sheet Balance Sheet Balance Sheet Balance Sheet Balance Sheet Balance Sheet Balance Sheet Balance Sheet -8,560 -356 0 0 8.858 -9,240 -5,356 0 1,658 0 4,436 0 6,733 3,089 9,822 9,135 6,778 45,141 2,224 0 63,278 177,395 -63,115 114,280 5,239 -2,864 2,375 18,102 5,671 140,428 203,706 1,592 38,410 19,152 1,021 5,375 -1,204 -3,956 0 0 -15.391 -4,471 -6,493 2,027 0 -28,284 116 -396 3,484 3,089 7,281 6,677 44,858 1,909 460 61,185 173,089 -57,725 115,364 5,589 -3,046 2,543 19,510 6,149 143,566 204,751 7,670 37415 18,793 966 4,668 57,689 179,492 -71,782 107,710 11,637 -5,169 6,468 17,037 9,921 141,136 198,825 1,099 41,433 20,654 921 2,821 0 -16,356 0 0 3,950 -14,217 -5,050 -15,289 -33 0 0 -30,639 0 -19,378 10,556 -8,822 8,869 5,986 46,523 3,325 -211 64,491 185,730 -54,733 130,998 7,008 -4,281 3,100 19,353 4,786 160,963 225 454 914 41,571 24,316 -179 6,009 99 72,730 60,239 176,958 -66,787 110,171 11,096 -4,751 6,345 16,695 6,131 139,342 199,581 2,708 38,487 19,607 521 3,310 59,940 165,825 -51,896 113,929 5,899 -3,147 2,752 20,497 5,987 143,165 203,105 6,805 38,080 18,808 2,211 6,152 -2,169 9,778 7,609 7,395 5,089 36,318 2,960 131 51,893 148,584 -43,486 105,098 5,905 -3,125 2,780 16,763 4,129 128,770 180,663 1,031 33,557 18,701 157 5,220 47 58,484 54,975 155,002 -45,399 109,603 5,936 -3,215 2,721 20,651 5,456 138,431 193,406 4,047 36,608 18,180 1,164 2,540 0 62,300 -12,631 0 5,938 3,840 9,778 7,907 4,144 32,713 3,128 140 48,032 137,848 -38,304 99,544 5,669 -2.906 2,763 16,126 3,942 122,375 170,407 523 30,451 18,734 1,347 4,615 92 55,543 -9,484 -3,326 -3,021 -1,057 0 -13,127 0 -1,938 2,356 418 7,151 3,613 32,724 2,658 -150 45,996 129,295 -36,288 93,007 5,047 -3,014 2,315 14,876 3,423 113,905 159,901 210 28,342 18,200 984 4,090 102 51,928 0 65,272 89 69,345 64,619 0 71,818 66,928 120 Big Store 121 Big Store 122 Big Store 123 Big Store 124 Big Store 125 Big Store 126 Big Store 127 Big Store 128 Big Store 129 Big Store 130 Big Store 131 Big Store 132 Big Store 133 Big Store 134 Big Store 135 Big Store 136 Big Store 137 Big Store 138 Big Store 139 Big Store 140 Big Store 141 Big Store 142 Big Store 143 Big Store 144 Big Store 145 Big Store Balance Sheet Balance Sheet Balance Sheet Balance Sheet Balance Sheet Balance Sheet Balance Sheet Balance Sheet Balance Sheet Balance Sheet Balance Sheet Income Statement Income Statement Income Statement Income Statement Income Statement Income Statement Income Statement Income Statement Income Statement Income Statement Income Statement Income Statement Income Statement Income Statement Income Statement Long-term debt Long-term capital lease and financing obligations Deferred income taxes and other Total noncurrent liabilities Total liabilities Common stock Capital in excess of par value Retained earnings Accumulated other comprehensive loss Total shareholders' equity Total liabilities and equity Sales revenue Credit card revenues Total revenues Cost of sales Gross margin Selling, general and administrative expenses Operating income Debt Capital lease and financing obligations EBIT Provision for income taxes Income from continuing operations Income from discontinued operations, net of income taxes Interest income Net income / loss) Consolidated net income attributable to noncontrolling interest 38,214 5,816 7,321 51,351 115,970 317 5,436 90,021 -11,597 83,611 199,581 478,614 3,516 482,130 360,984 121,146 97,041 24,105 4411 521 19,173 6,558 12,615 0 2,467 15,080 -386 41,086 2,606 8,805 52,497 117,769 323 6,914 85,777 -7,168 85,937 203,706 482,229 3,422 485,651 365,086 120,565 93,418 27,147 4,292 300 22,555 7,985 14,570 285 2,348 17,099 -736 41,771 2,788 9.508 54,067 123,412 323 7,455 76,566 -2,996 81,339 204,751 473,076 3,218 476,294 358,069 118,225 91,353 26,872 4,160 263 22,449 8,105 14,344 144 2,216 16,695 38,394 3,023 8,536 49,953 121,771 332 7,766 72,978 -587 81,738 203,105 465,604 3,047 468,651 352,297 116,354 88,629 27,725 4,007 272 23,446 7,958 15,488 52 2,063 17,756 44,070 3,009 8,421 55,500 117,800 342 6,817 68,691 -1,410 75,761 193406 443,854 3,096 446,950 335,127 111,823 85,265 26,558 4,104 288 22,166 7,944 14,222 -67 2,160 16,387 40,692 3,150 8,425 52,267 110,751 352 5,076 63,967 646 71,247 180,663 418,952 2,897 421,849 314,946 106,903 81,361 25,542 3,948 277 21,317 7,579 13,738 1,034 2,004 16,993 33,231 3,170 8,324 44,725 100,268 378 4,551 66,357 -70 72,648 170,407 405,132 2,953 408,085 304,444 103,641 76,639 24,002 3,828 278 19,896 7,156 12,740 -79 1,884 14,883 50,490 3,563 8,152 62,205 134,935 65 5,377 84,645 433 90,520 225 454 523,315 3,246 526,936 393,308 133,629 101,326 30,955 2,698 8,024 41,677 93,605 73 4,138 62,433 -348 66,296 159,901 380,542 2,494 383,318 285,895 97,423 71,759 22,280 3,433 220 18,627 6,445 12,182 -356 1,489 13,708 31,553 4,074 260 27,219 9,099 18,120 918 2,130 20,866 146 Big Store 147 Big Store 148 Big Store 149 Big Store 150 Big Store 151 Big Store 152 Big Store 153 Big Store 154 Big Store 155 Big Store 156 Big Store 157 Big Store 158 Big Store 159 Big Store Income Statement Income Statement Cash Flows Cash Flows Cash Flows Cash Flows Cash Flows Cash Flows Cash Flows Cash Flows Cash Flows Cash Flows Cash Flows Cash Flows Consolidated net income to corporation Consolidated net income Income from discontinued operations, net of income taxes Income from continuing operations Depreciation and amortization Deferred income taxes Other operating activities Receivables, net Inventories Accounts payable Accrued liabilities Accrued income taxes Net cash flows from operating activities 14,694 15,080 0 15,080 9,454 -672 1,410 -19 -703 2,008 1,303 -472 27,389 16,363 17,099 -285 16,814 9,173 -503 785 -569 -1,229 2,678 1,249 166 28,564 -673 16,022 16,695 -144 16,551 8,870 -279 938 -566 -1,667 531 103 -1,224 23,257 -757 16,999 17,756 -52 17,704 8,478 -133 602 -614 -2,759 1,061 271 981 25,591 -688 15,699 16,387 67 16,454 8,130 1,050 398 -796 -3,727 2,687 -935 994 24,255 -604 16,389 16,993 -1,034 15,959 7,641 651 1,087 -733 -3,205 2,676 -280 -153 23,643 -513 14,370 14,883 79 14,962 7,157 -504 318 -297 2,213 1,052 1,348 0 26,249 -755 20,111 20,866 -1,668 19,199 9,176 439 984 -818 -4,381 2,970 -725 0 26,843 -402 13,226 13,708 -208 13,500 6,446 -756 17 -561 1,798 707 985 -282 21,854 192 11,125 11,125 -6,288 Cash Flows wares Cache Cash Flow Cash Flows Cash Flowe Cash Flow Cash Flow Cash Flow Cash Flow Cash Flow Cash Flows Cash Flow Cash Flows Cash Flows ware Cash Flows Net cash flows from operating activities Payments for property and equipment and equipment sto Purchase of available for sale securities acons Investment and business acquisitions, net of cash acquired Other investing activities Net cash flows from investing activities Net change in short-term borrowings Proceeds from issuance of long-term debt annens of long-term debt Purchase of Company stock Dividends paid to noncontrolling interest Purchase of noncontrolling interest Other financing activities Net cash flows from financing activities Effect of exchange rates on cash and cash equivalents coachecast decrease in cash and cash equivalents Cash & cash equivalents, end of year 185 -1844 -15,071 10,789 Big Store Rig Store 085
Step by Step Solution
There are 3 Steps involved in it

Get step-by-step solutions from verified subject matter experts