

Question: I am trying to make these two graphs be on the same graph but have different colors to identify them. So far I have both
I am trying to make these two graphs be on the same graph but have different colors to identify them. So far I have both graphs, but they are separate. Thanks! I have included my entire code as well as the graph I created. In python please!

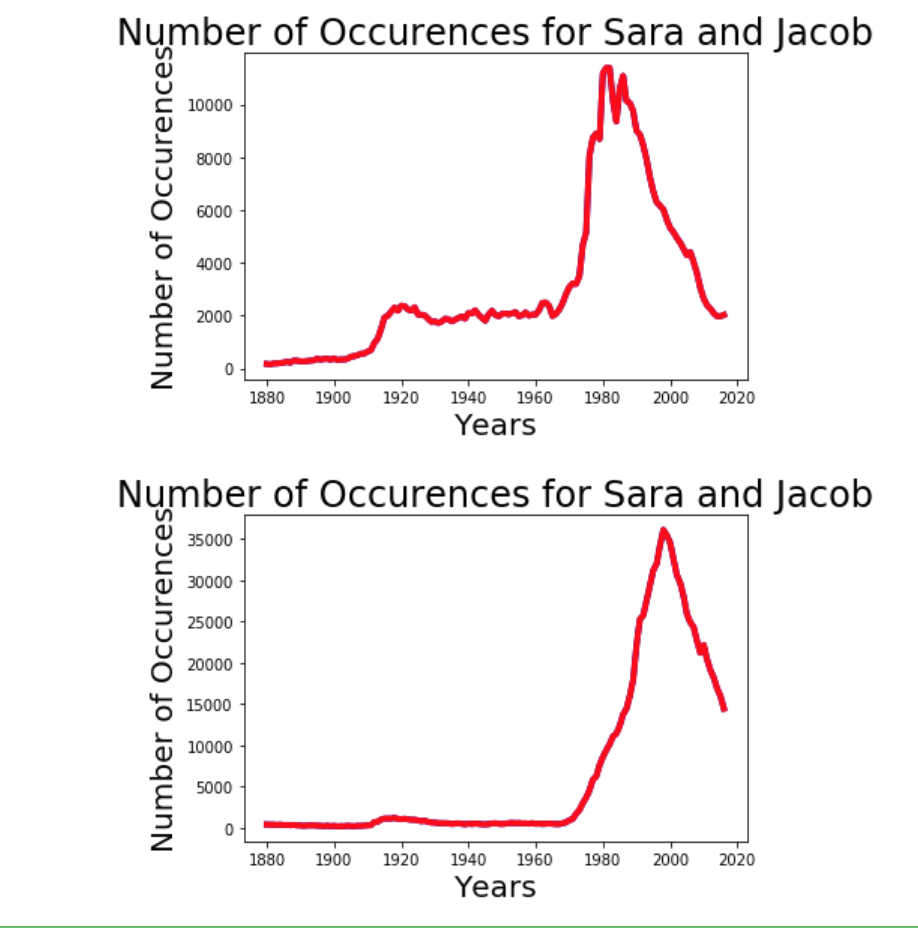
In [611: from matplotlib import pyplot as plt def count_occurences_infile (path, target): targetcount0 tota!count = 0 file - open (path, "r") for line in file: columns - line.split(",") if (columns [0] -= target): targetcount - targetcount + int(columns [ 21) totalcount-totalcount + int (columns [ 2) return(targetcount, totalcount) def count_occurences_in years (years, target) data- [ or year in years: path - 'names/yob' str (year) + '.txt' occurences-count_occurences_in_file(path, target) data.append (occurences) return data def plot_national_occurences (data, years, target): occurences -[] for info in data: a - info[0] occurences.append (a) plt.plot (years, occurences, "b", linewidth-4) plt.xlabel( 'Years plt.ylabel( 'Number of Occurences', fontsize - 20) plt.title ('Number of Occurences for Sara and Jacob' , fontsize - 24) plt.show () ', fontsize- 20) yearsrange (1880, 2017) data count occurences in vears (vearsSara) plot_national_occurences (data, years, Sara) data-count_occurences_in_years (years, Jacob') plot national_occurences (data, years, 'Jacob')
Step by Step Solution
There are 3 Steps involved in it

Get step-by-step solutions from verified subject matter experts