

Question: I am trying to plot a function in python 2.7.12 and keep getting a syntax error at xd3.append(0). I'm basing the script off of another
I am trying to plot a function in python 2.7.12 and keep getting a syntax error at xd3.append(0). I'm basing the script off of another script through which my function was derived, which I will attach as well. Can someone help me revise my script so that I can actually plot it out? Thanks so much!
I posted this question once before, and the response was rediciulous dense and impossible for me to copy or learn from. First code again is what I've tried, second code is what I've based it on.
My Script:
import math from numpy import matrix from numpy import linalg import numpy import matplotlib.pyplot as plt import sys m = 11 first = 0 second = 0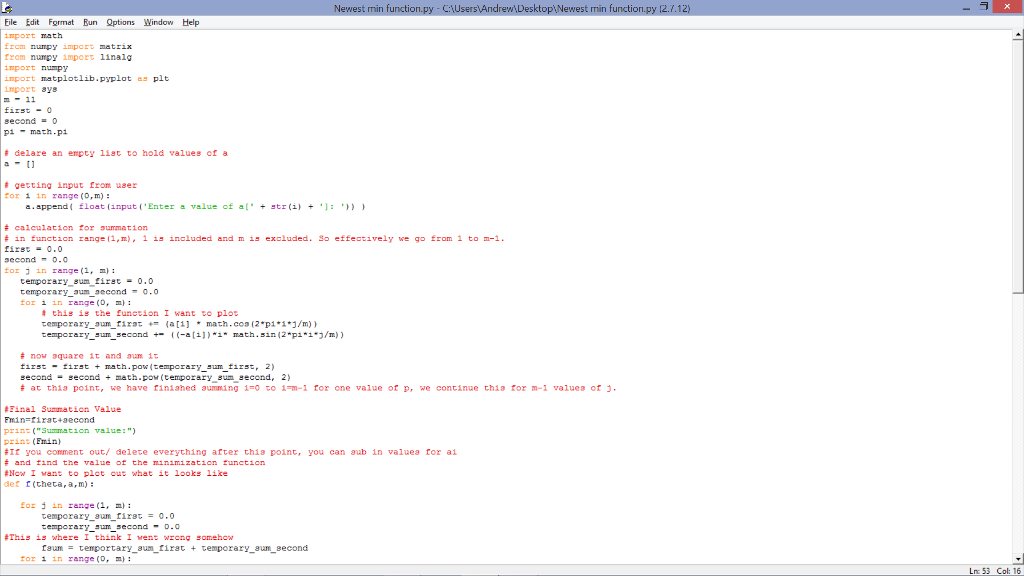
 pi = math.pi
# delare an empty list to hold values of a a = []
# getting input from user for i in range(0,m): a.append( float(input('Enter a value of a[' + str(i) + ']: ')) )
# calculation for summation # in function range(1,m), 1 is included and m is excluded. So effectively we go from 1 to m-1. first = 0.0 second = 0.0 for j in range(1, m): temporary_sum_first = 0.0 temporary_sum_second = 0.0 for i in range(0, m): # this is the function I want to plot temporary_sum_first += (a[i] * math.cos(2*pi*i*j/m)) temporary_sum_second += ((-a[i])*i* math.sin(2*pi*i*j/m))
# now square it and sum it first = first + math.pow(temporary_sum_first, 2) second = second + math.pow(temporary_sum_second, 2) # at this point, we have finished summing i=0 to i=m-1 for one value of p, we continue this for m-1 values of j.
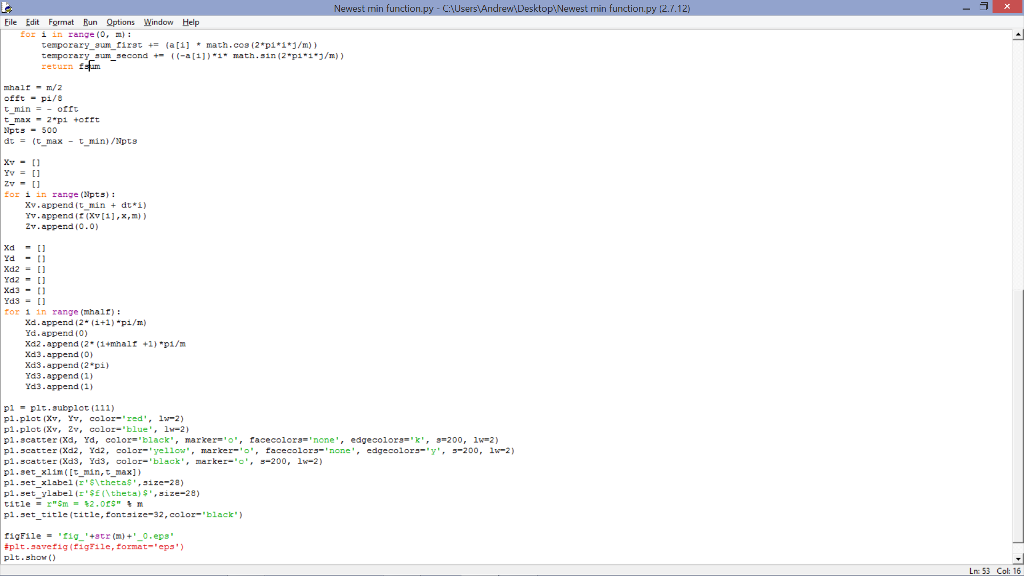
#Final Summation Value Fmin=first+second print("Summation value:") print(Fmin) #If you comment out/ delete everything after this point, you can sub in values for ai # and find the value of the minimization function #Now I want to plot out what it looks like def f(theta,a,m): for j in range(1, m): temporary_sum_first = 0.0 temporary_sum_second = 0.0 #This is where I think I went wrong somehow fsum = temportary_sum_first + temporary_sum_second for i in range(0, m): temporary_sum_first += (a[i] * math.cos(2*pi*i*j/m)) temporary_sum_second += ((-a[i])*i* math.sin(2*pi*i*j/m)) return fsum
mhalf = m/2 offt = pi/8 t_min = - offt t_max = 2*pi +offt Npts = 500 dt = (t_max - t_min)/Npts
Xv = [] Yv = [] Zv = [] for i in range(Npts): Xv.append(t_min + dt*i) Yv.append(f(Xv[i],x,m)) Zv.append(0.0)
Xd = [] Yd = [] Xd2 = [] Yd2 = [] Xd3 = [] Yd3 = [] for i in range(mhalf): Xd.append(2*(i+1)*pi/m) Yd.append(0) Xd2.append(2*(i+mhalf +1)*pi/m Xd3.append(0) Xd3.append(2*pi) Yd3.append(1) Yd3.append(1)
p1 = plt.subplot(111) p1.plot(Xv, Yv, color='red', lw=2) p1.plot(Xv, Zv, color='blue', lw=2) p1.scatter(Xd, Yd, color='black', marker='o', facecolors='none', edgecolors='k', s=200, lw=2) p1.scatter(Xd2, Yd2, color='yellow', marker='o', facecolors='none', edgecolors='y', s=200, lw=2) p1.scatter(Xd3, Yd3, color='black', marker='o', s=200, lw=2) p1.set_xlim([t_min,t_max]) p1.set_xlabel(r'$\theta$',size=28) p1.set_ylabel(r'$f(\theta)$',size=28) title = r"$m = %2.0f$" % m p1.set_title(title,fontsize=32,color='black')
figFile = 'fig_'+str(m)+'_0.eps' #plt.savefig(figFile,format='eps') plt.show()
Reference Script:
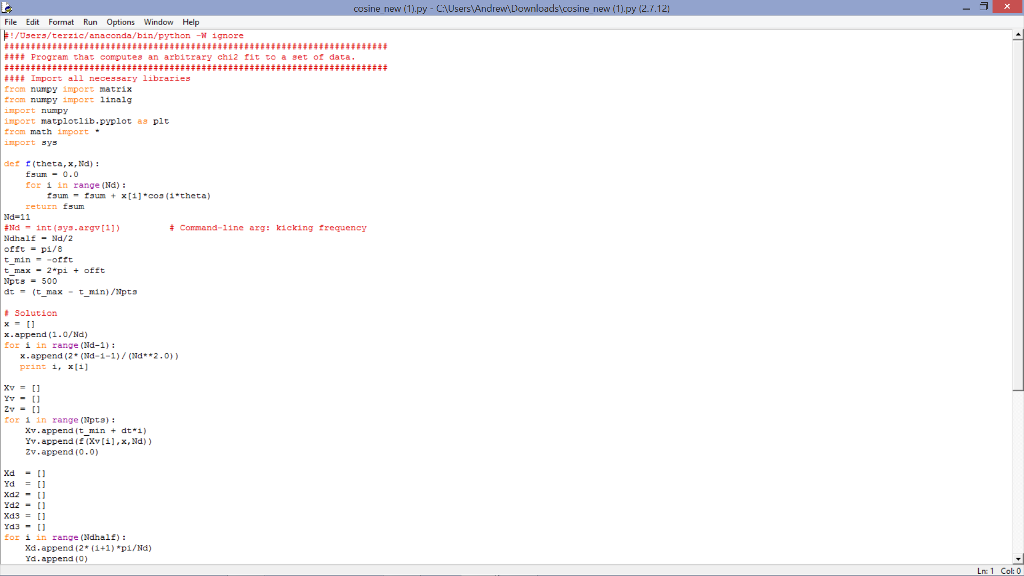
from numpy import matrix from numpy import linalg import numpy import matplotlib.pyplot as plt from math import * import sys
def f(theta,x,Nd): fsum = 0.0 for i in range(Nd): fsum = fsum + x[i]*cos(i*theta) return fsum Nd=11 #Nd = int(sys.argv[1]) # Command-line arg: kicking frequency Ndhalf = Nd/2 offt = pi/8 t_min = -offt t_max = 2*pi + offt Npts = 500 dt = (t_max - t_min)/Npts
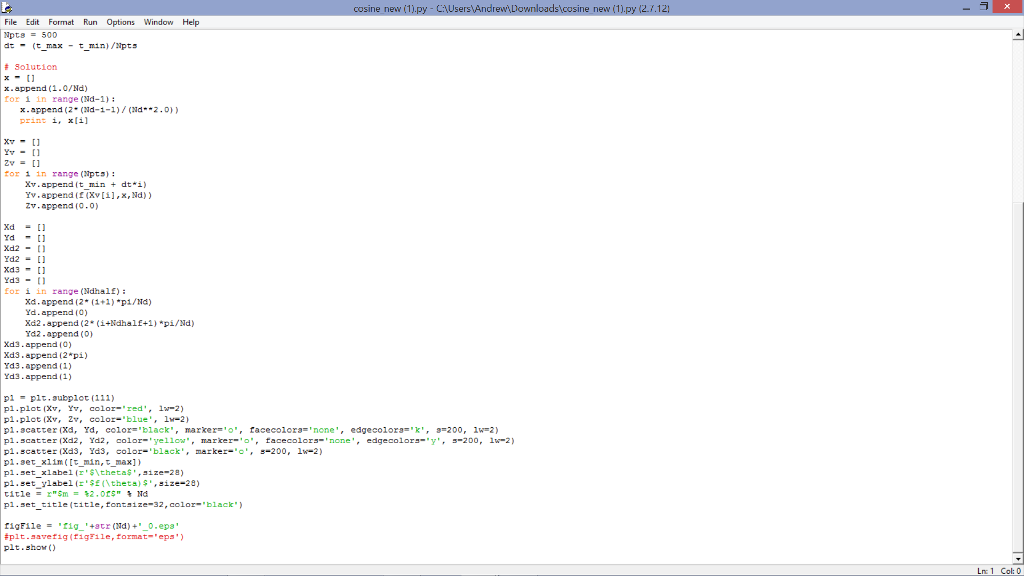
# Solution x = [] x.append(1.0/Nd) for i in range(Nd-1): x.append(2*(Nd-i-1)/(Nd**2.0)) print i, x[i]
Xv = [] Yv = [] Zv = [] for i in range(Npts): Xv.append(t_min + dt*i) Yv.append(f(Xv[i],x,Nd)) Zv.append(0.0)
Xd = [] Yd = [] Xd2 = [] Yd2 = [] Xd3 = [] Yd3 = [] for i in range(Ndhalf): Xd.append(2*(i+1)*pi/Nd) Yd.append(0) Xd2.append(2*(i+Ndhalf+1)*pi/Nd) Yd2.append(0) Xd3.append(0) Xd3.append(2*pi) Yd3.append(1) Yd3.append(1)
p1 = plt.subplot(111) p1.plot(Xv, Yv, color='red', lw=2) p1.plot(Xv, Zv, color='blue', lw=2) p1.scatter(Xd, Yd, color='black', marker='o', facecolors='none', edgecolors='k', s=200, lw=2) p1.scatter(Xd2, Yd2, color='yellow', marker='o', facecolors='none', edgecolors='y', s=200, lw=2) p1.scatter(Xd3, Yd3, color='black', marker='o', s=200, lw=2) p1.set_xlim([t_min,t_max]) p1.set_xlabel(r'$\theta$',size=28) p1.set_ylabel(r'$f(\theta)$',size=28) title = r"$m = %2.0f$" % Nd p1.set_title(title,fontsize=32,color='black')
figFile = 'fig_'+str(Nd)+'_0.eps' #plt.savefig(figFile,format='eps') plt.show()
Newe min function py C: Users Andrew Deskto min function 2./.12) Eile Edit Format Bun Options Wind Help from numpy import linalg numpy tplotlib. pyplot plt import ays 11 second pi math -pi delare an empty liat to hold values of a getting input from user for in range (0,m a append float (input ('Enter a value of al' str (i) 'J: calculation for summation in function range 1 m), 1 is included and m is excluded. So effectively we go from 1 to m-1. first second o.o temporary sum firat 0.0 ry aum aecond t this is the function I want to plot temporary aum firat +T (atij maths. coa (2 pi i j /m) emporary aum cond ((-al11) 1 math sin 2 pi 1 J/m) now a quare it and aum it first first math.pow (temporary sum first, 2) second second math pow (temporary sum aecond, 2) at thia point, we have finiahed aumming 1 0 to 1 m-1 for one value of p we continue thia for m-1 valuea of J. #Final Summation Value Fmin firat aecond print ("Summation value print #If you comment out delete everything after thia point you can aub in valuea for ai #Now I want to plot out what it looks like f (theta, arm for j in range (1, temporary aum first 0.0 This is wher I th k I faum temportary aum firat temporary aum second
Step by Step Solution
There are 3 Steps involved in it

Get step-by-step solutions from verified subject matter experts