

Question: I am unable to attach an excel file, however if you could answer the question with your email I can always send it that way.
 I am unable to attach an excel file, however if you could answer the question with your email I can always send it that way.
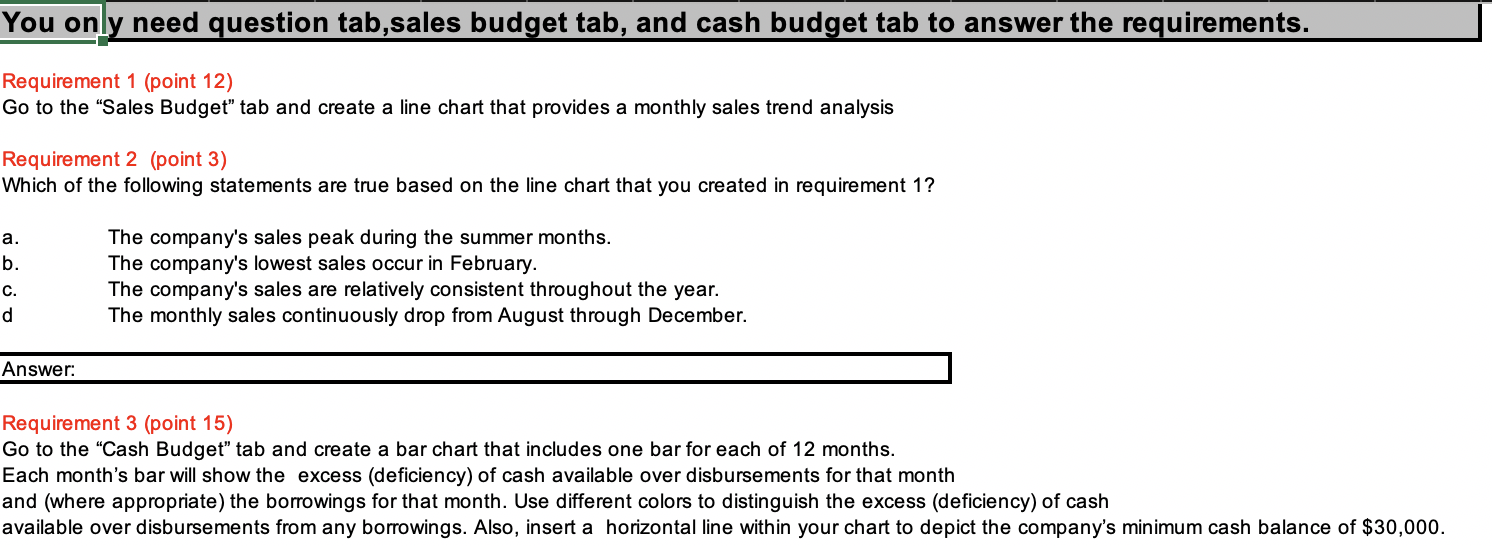
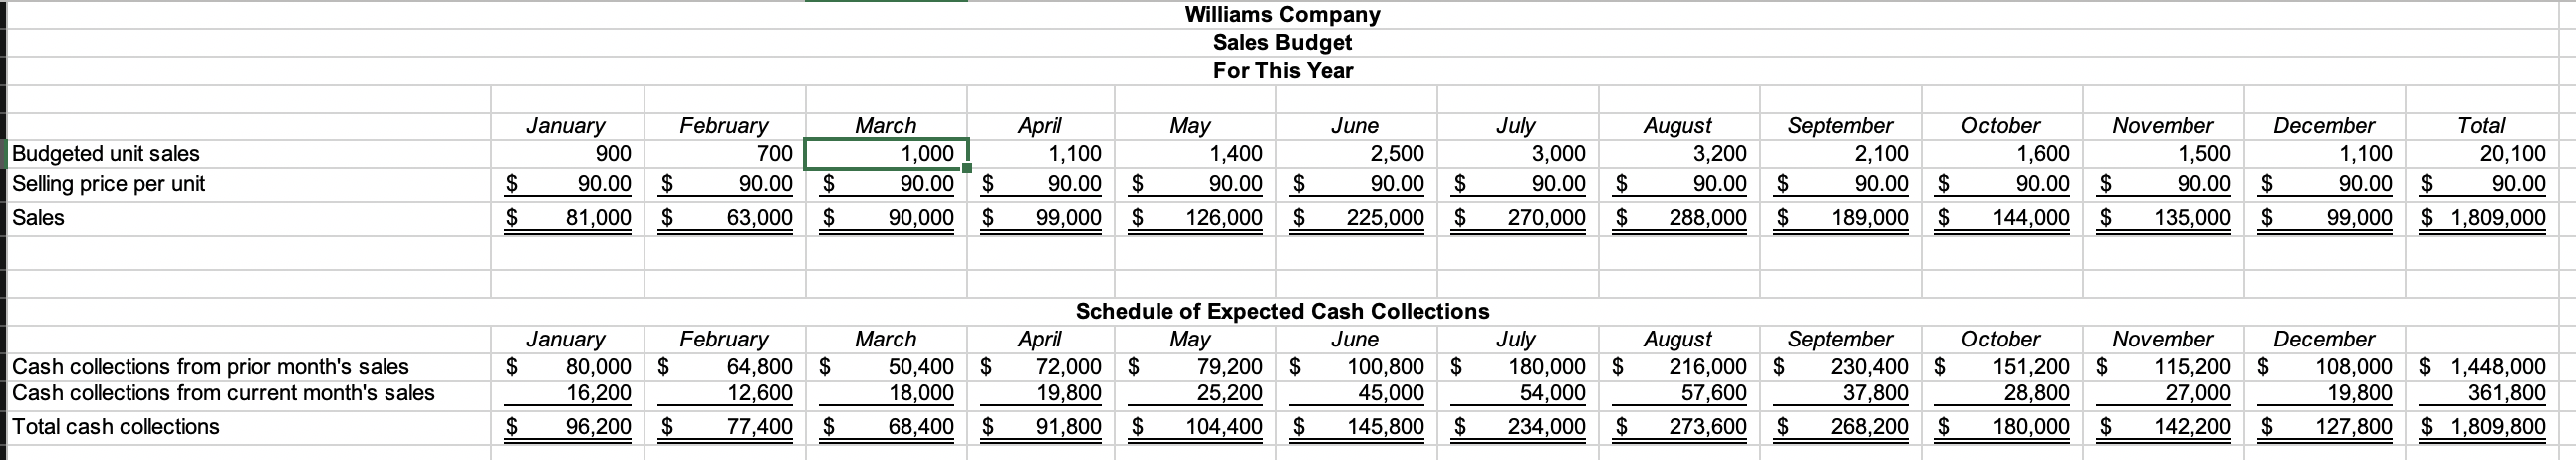
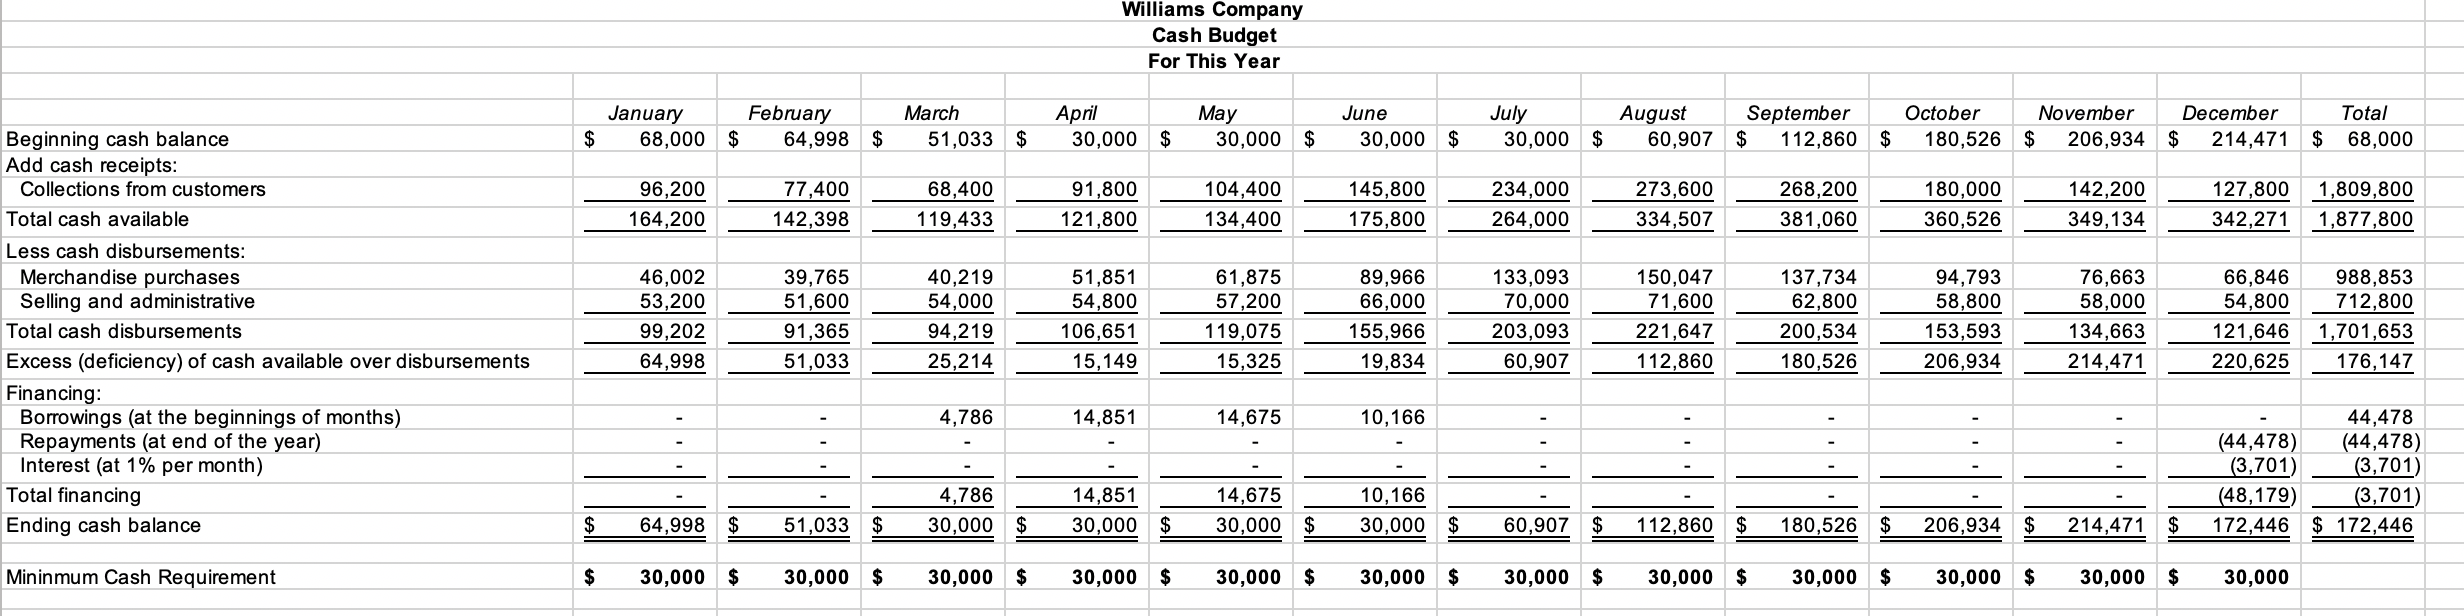
Requirement 1 (point 12) Go to the "Sales Budget" tab and create a line chart that provides a monthly sales trend analysis Requirement 2 (point 3) Which of the following statements are true based on the line chart that you created in requirement 1 ? a. The company's sales peak during the summer months. b. The company's lowest sales occur in February. c. The company's sales are relatively consistent throughout the year. d The monthly sales continuously drop from August through December. Answer: Requirement 3 (point 15) Go to the "Cash Budget" tab and create a bar chart that includes one bar for each of 12 months. Each month's bar will show the excess (deficiency) of cash available over disbursements for that month and (where appropriate) the borrowings for that month. Use different colors to distinguish the excess (deficiency) of cash available over disbursements from any borrowings. Also, insert a horizontal line within your chart to depict the company's minimum cash balance of $30,000. Williams Company Sales Budget For This Year Williams Company Cash Budget For This Year Beginning cash balance Add cash receipts: Collections from customers Total cash available Less cash disbursements: Merchandise purchases Selling and administrative Excess (deficiency) of cash available over disbursements Financing: Borrowings (at the beginnings of months) Repayments (at end of the year) Interest (at 1% per month) Total financing Ending cash balance Requirement 1 (point 12) Go to the "Sales Budget" tab and create a line chart that provides a monthly sales trend analysis Requirement 2 (point 3) Which of the following statements are true based on the line chart that you created in requirement 1 ? a. The company's sales peak during the summer months. b. The company's lowest sales occur in February. c. The company's sales are relatively consistent throughout the year. d The monthly sales continuously drop from August through December. Answer: Requirement 3 (point 15) Go to the "Cash Budget" tab and create a bar chart that includes one bar for each of 12 months. Each month's bar will show the excess (deficiency) of cash available over disbursements for that month and (where appropriate) the borrowings for that month. Use different colors to distinguish the excess (deficiency) of cash available over disbursements from any borrowings. Also, insert a horizontal line within your chart to depict the company's minimum cash balance of $30,000. Williams Company Sales Budget For This Year Williams Company Cash Budget For This Year Beginning cash balance Add cash receipts: Collections from customers Total cash available Less cash disbursements: Merchandise purchases Selling and administrative Excess (deficiency) of cash available over disbursements Financing: Borrowings (at the beginnings of months) Repayments (at end of the year) Interest (at 1% per month) Total financing Ending cash balance
Step by Step Solution
There are 3 Steps involved in it

Get step-by-step solutions from verified subject matter experts