

Question: I am unsure about which hypothesis test would be best for this problem, im thinking one-way anova? any help would be appreciated! Also for part
I am unsure about which hypothesis test would be best for this problem, im thinking one-way anova? any help would be appreciated!
Also for part b. The entire data set (4x259) has a certain amount of variation, which equals the total variation.If we built a model using the name of the stock to explain the data we say in that 'Name' column below, what percent of the total variation could be explained? In other words, how much of the total variation can be explained by Stock Name?
We would like to see if BAC behaves differently than other bank stocks. Using 249 days of percent change in data we get the following:
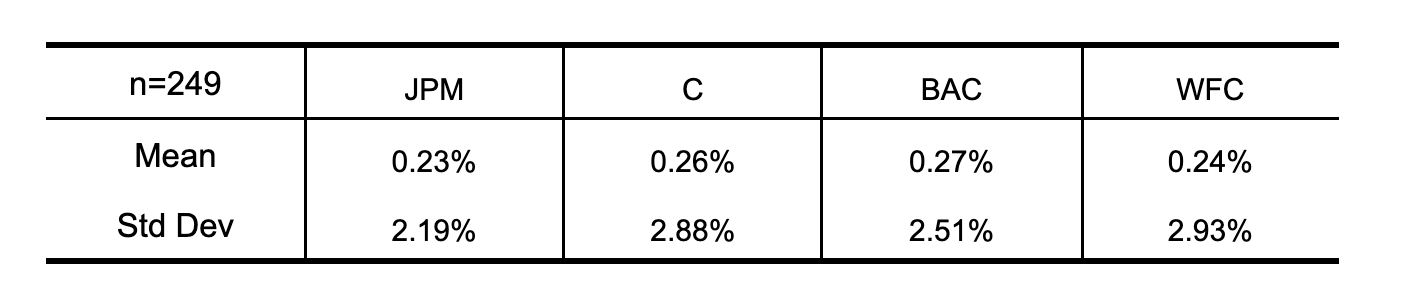
n=249 JPM C BAC WFC Mean 0.23% 0.26% 0.27% 0.24% Std Dev 2.19% 2.88% 2.51% 2.93%
Step by Step Solution
There are 3 Steps involved in it

Get step-by-step solutions from verified subject matter experts