

Question: I am very perplexed on this. The first image is what we are using. The second is an example of what to do. I am
I am very perplexed on this. The first image is what we are using. The second is an example of what to do. I am so confused.
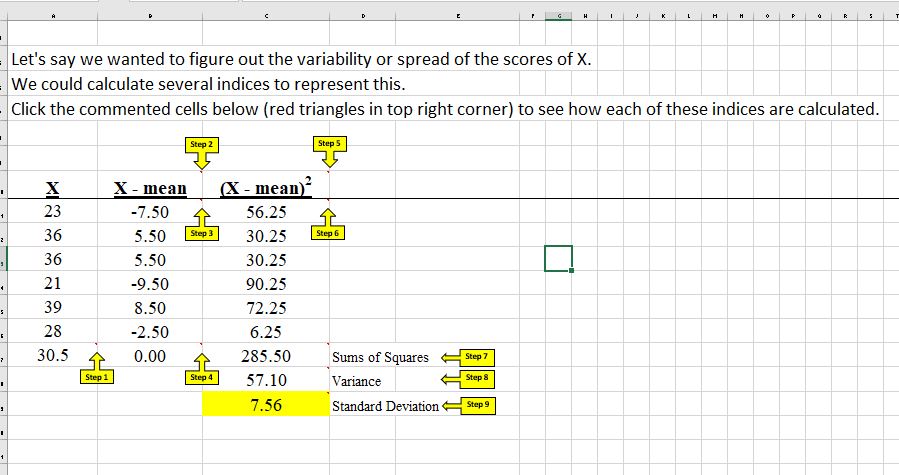
Use the template provided in Lesson L01b to determine the standard deviation for "fear." In your template be sure to label your mean, deviations, squared deviations, sums of squares, variance, and standard deviation.
NOTE: Please do all calculations in the Excel spreadsheet. This means that your cells will include formulas and not just raw values entered into the cells.
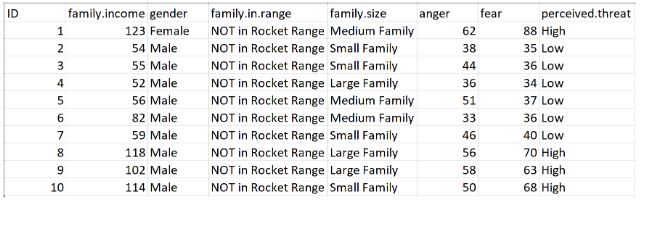
\fID family.income gender family.in.range family.size anger fear perceived.threat 123 Female NOT in Rocket Range Medium Family 62 88 High 54 Male NOT in Rocket Range Small Family 38 35 Low 55 Male NOT in Rocket Range Small Family 44 36 Low 52 Male NOT in Rocket Range Large Family 36 34 Low 56 Male NOT in Rocket Range Medium Family 51 37 Low 82 Male NOT in Rocket Range Medium Family 33 36 Low 59 Male NOT in Rocket Range Small Family 46 40 Low 118 Male NOT in Rocket Range Large Family 56 70 High 102 Male NOT in Rocket Range Large Family 58 63 High 10 114 Male NOT in Rocket Range Small Family 50 68 High
Step by Step Solution
There are 3 Steps involved in it

Get step-by-step solutions from verified subject matter experts