

Question: I am working on my Statistic assignment. I have solved the first 3 questions and need help answering the last to that follow up with
I am working on my Statistic assignment. I have solved the first 3 questions and need help answering the last to that follow up with the data I have attached below.
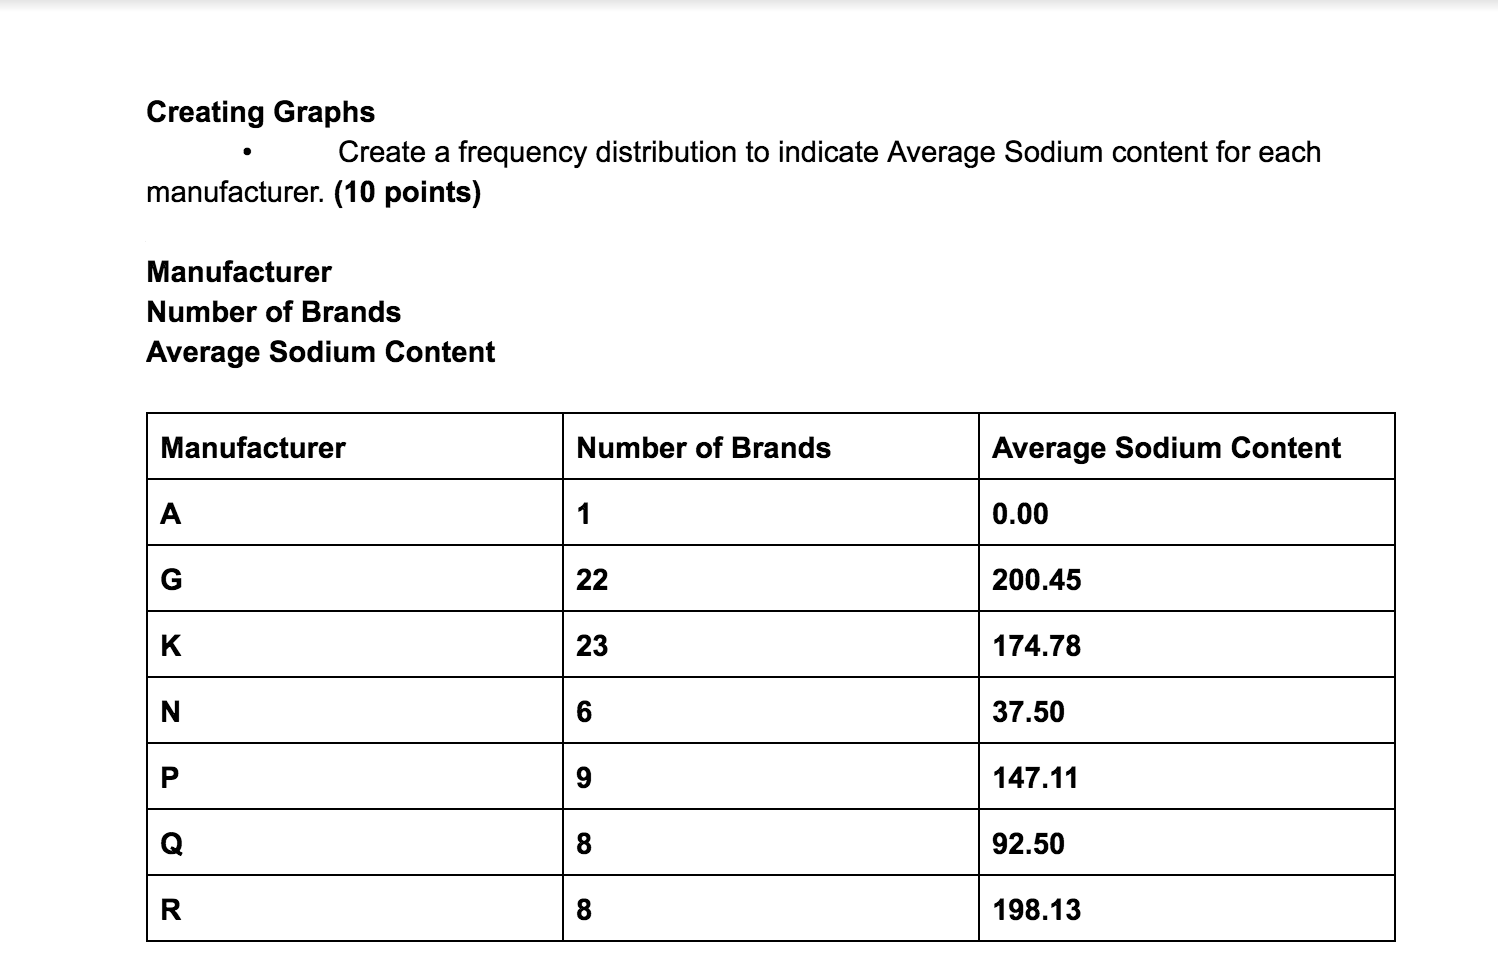
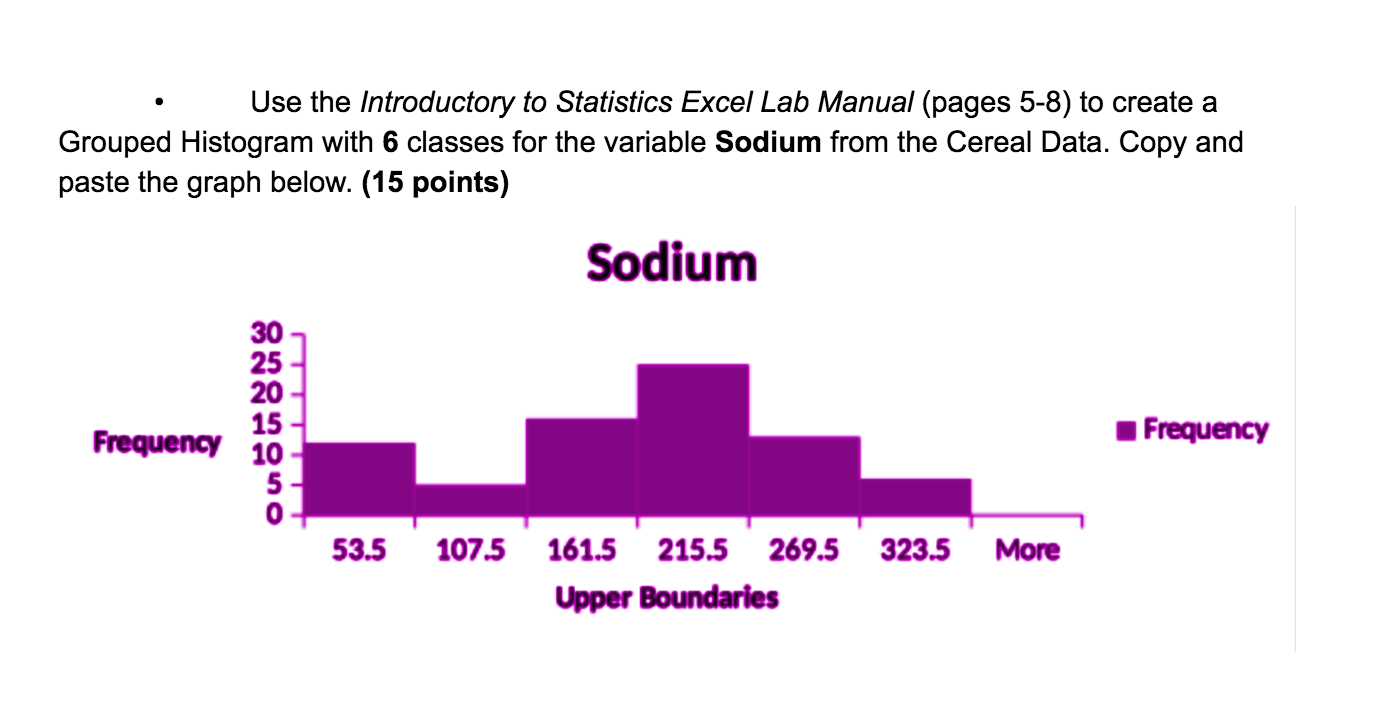
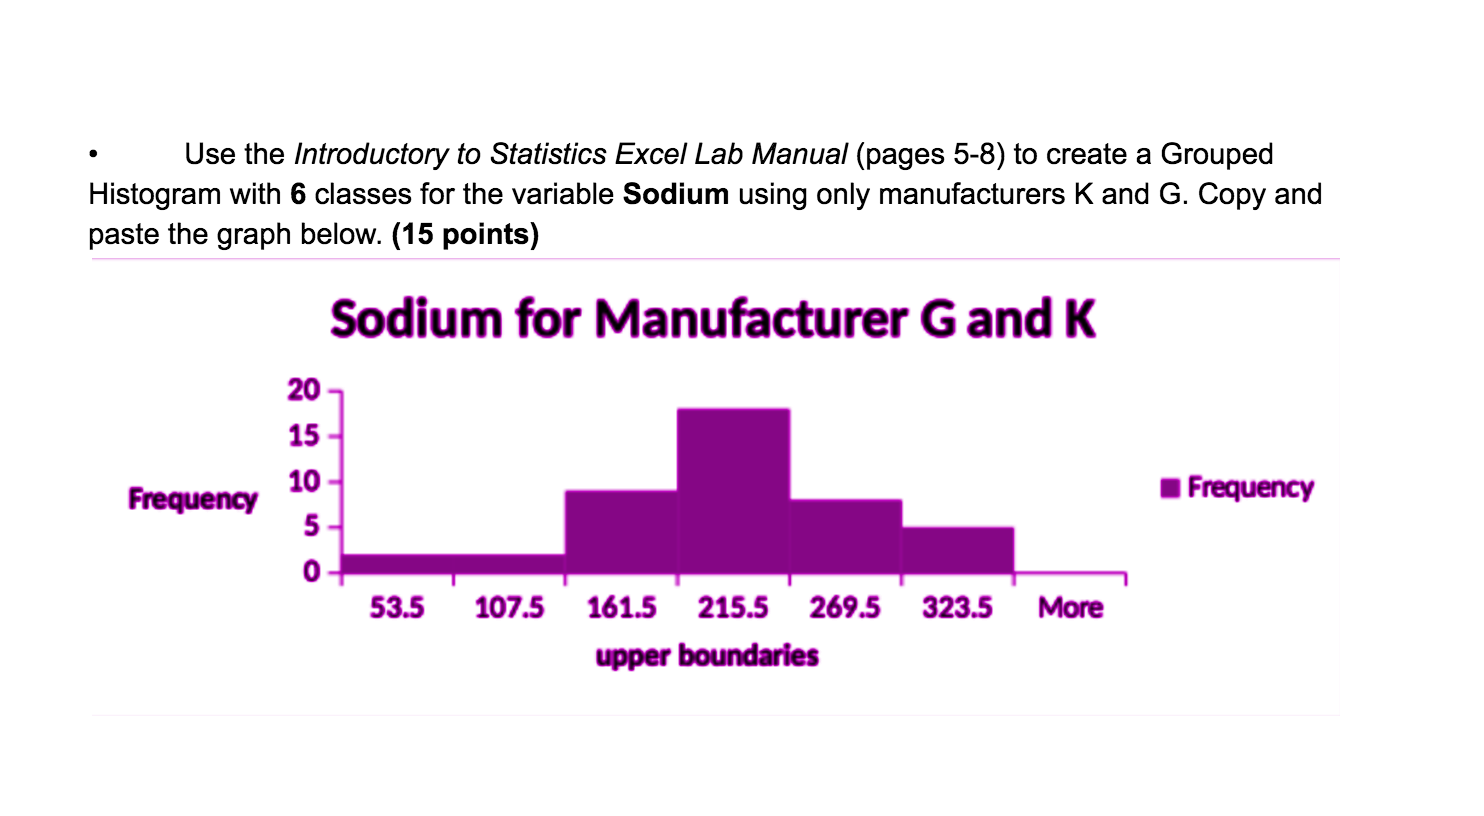
Creating Graphs - Create a frequency distribution to indicate Average Sodium content for each manufacturer. (10 points) Manufacturer Number of Brands Average Sodium Content m Number of Brands Average Sodium Content Use the Introductory to Statistics Excel Lab Manual (pages 5-8) to create a Grouped Histogram with 6 classes for the variable Sodium from the Cereal Data. Copy and paste the graph below. (15 points) Sodium 30 25 20 Frequency 15 10 Frequency ous 53.5 107.5 161.5 215.5 269.5 323.5 More Upper Boundaries- Use the Introductory to Statistics Excel Lab Manual (pages 5-8) to create a Grouped Histogram with 6 classes for the variable Sodium using only manufacturers K and G. Copy and paste the graph below. (15 points) Sodium for Manufacturer G and K 20 15 10 5 0 m 53.5 1075 161.5 215.5 269.5 323.5 Mom mm - Create a box-and-whisker plot of the Sodium content for a sample. Use either the Cluster or Stratified technique. (15 points)
Step by Step Solution
There are 3 Steps involved in it

Get step-by-step solutions from verified subject matter experts