

Question: I am working on my Statistic assignment. I have solved the first 3 questions and need help answering the last to that follow up with
I am working on my Statistic assignment. I have solved the first 3 questions and need help answering the last to that follow up with the data I have attached below.
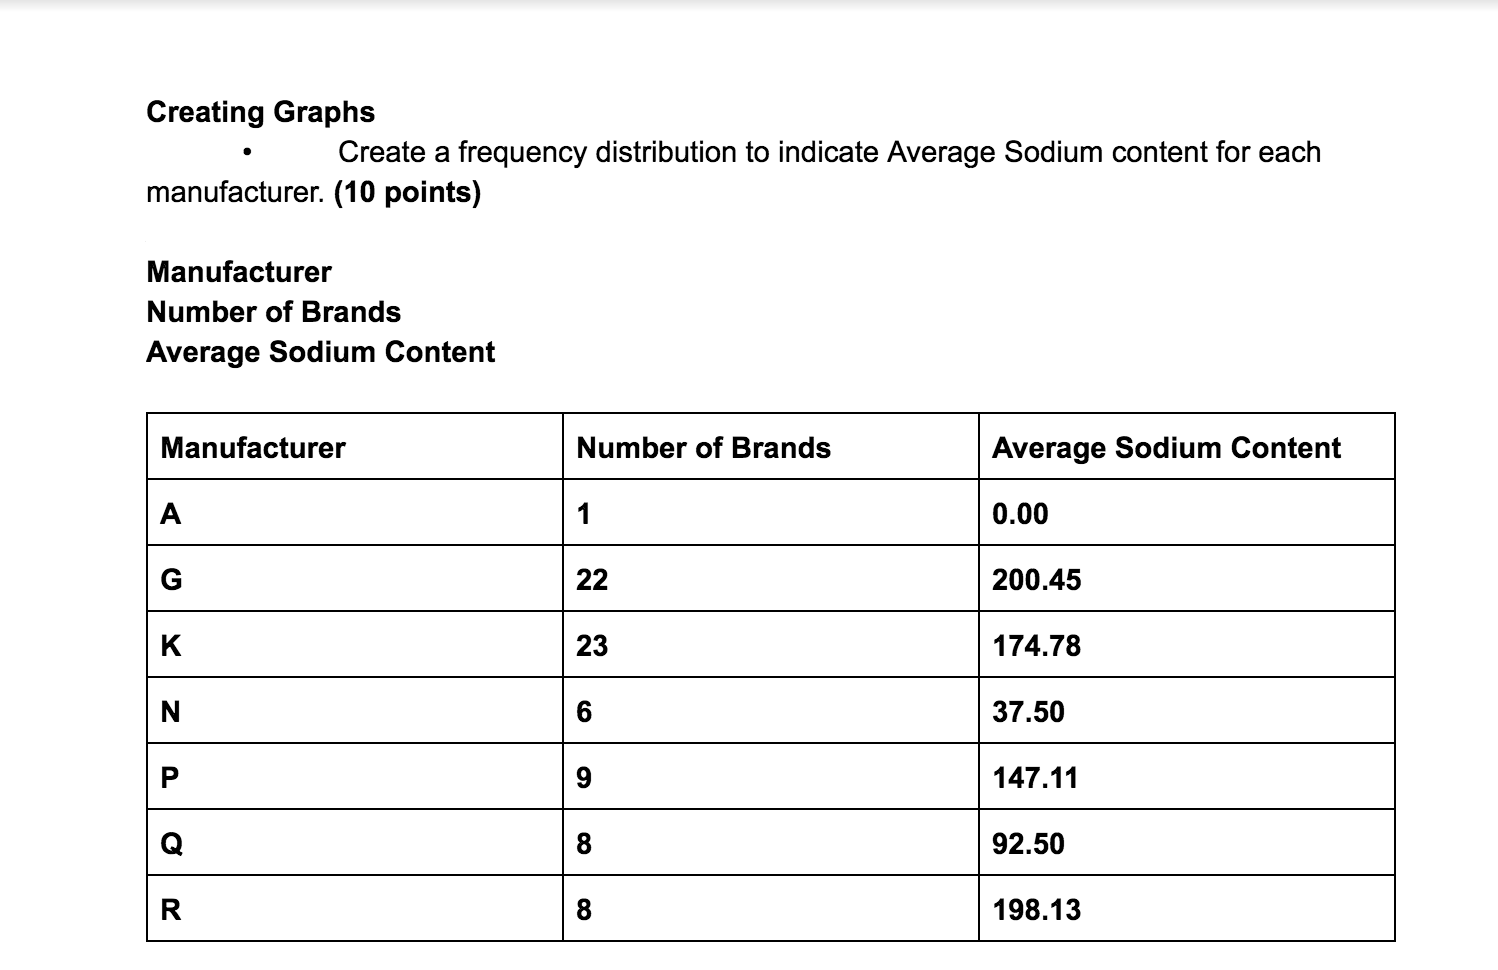
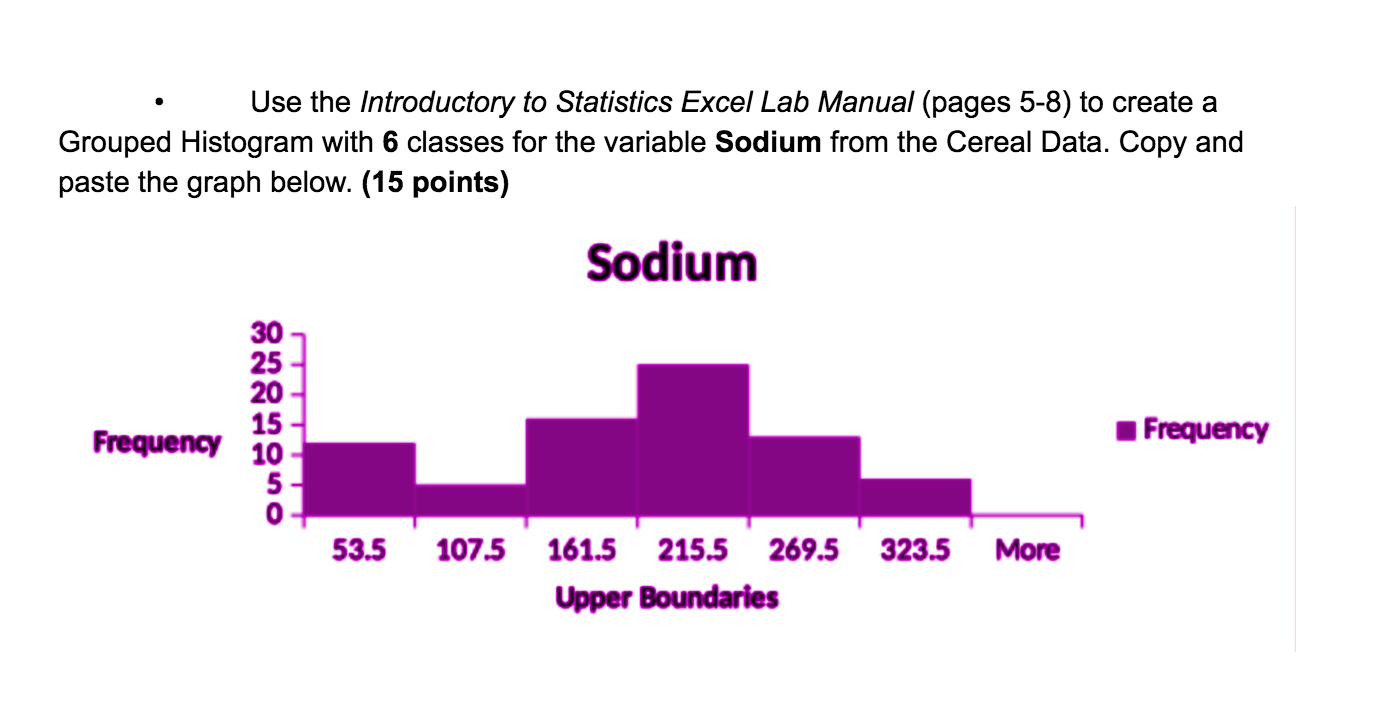
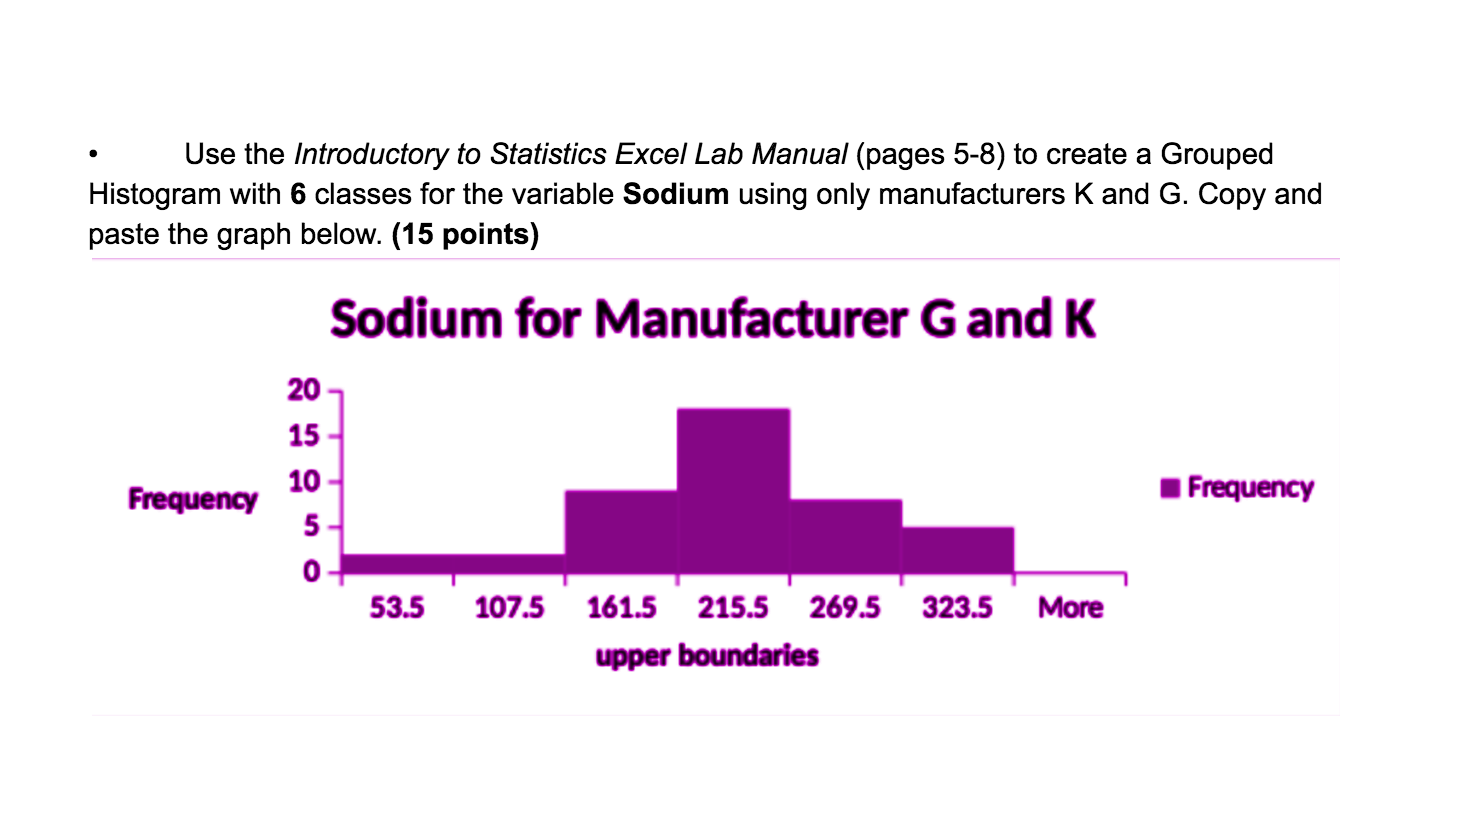
0 How do the histograms in #2 and #3 compare? Is this what you expected? Explain. (6 poinu) - Are them any outliers present in the Sodium content population data? Can you tell from the Histogram? Is it more/less obvious from the Box-and Whiskers Plot? (6 poi-m) . Are them any outliers present in the Sodium content sample data used to create the Box-and Whiskers plot? (6 mints) - Use the Immductory to Statistics Excel lab Manual (pages 1416) to calculate the Descriptive Statistics for the Sodium content of the population. What is the Mean, Median and skewness? How does this information relate to the shape of the distribution? (a points) Mean: Skewness: Creating Graphs - Create a frequency distribution to indicate Average Sodium content for each manufacturer. (10 points) Manufacturer Number of Brands Average Sodium Content m Number of Brands Average Sodium Content Use the Introductory to Statistics Excel Lab Manual (pages 5-8) to create a Grouped Histogram with 6 classes for the variable Sodium from the Cereal Data. Copy and paste the graph below. (15 points) Sodium 30 25 20 Frequency 15 10 Frequency ous 53.5 107.5 161.5 215.5 269.5 323.5 More Upper Boundaries- Use the Introductory to Statistics Excel Lab Manual (pages 5-8) to create a Grouped Histogram with 6 classes for the variable Sodium using only manufacturers K and G. Copy and paste the graph below. (15 points) Sodium for Manufacturer G and K 20 15 10 5 0 m 53.5 1075 161.5 215.5 269.5 323.5 Mom mm - Use the Introductory to Statistics Excel Lab Manual (pages 17-19) to create a Box-and-Whisker plot (Box Plot) for the Sodium content of the population. (15 points) - Create a box-and-whisker plot of the Sodium content for a sample. Use either the Cluster or Stratified technique. (15 points)
Step by Step Solution
There are 3 Steps involved in it

Get step-by-step solutions from verified subject matter experts