

Question: I attached all the documents needed and SPSS is required for this. I am really hoping that I can be helped by tomorrow evening. I
I attached all the documents needed and SPSS is required for this. I am really hoping that I can be helped by tomorrow evening. I would really appreciate it. Thank you!
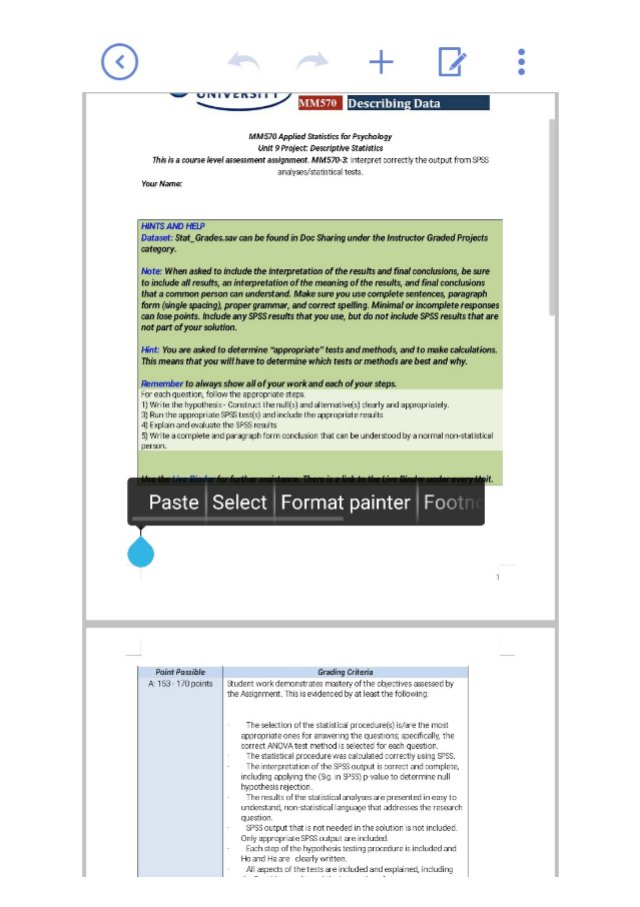 + LU HHS?\" MMHO Applied Statistics for Psychology Unit 9 Project Descriptive Statistics This is a course level assessment assignment. MMm-l Interpret correctly the output from SPSS analyses/ statistical tests. Your Name: For each question, follow the appropriate steps. 1) Write the hypothesis- Construct the nul|(s) and altemative(s) clearly and appropriately. 3) Run the appropriate SP$ test(s) and include the appropriate results 4) Explain and evaluate the SPSS results 5) Write acomplete and paragraph form conclusion that can be understood by a normal nonstatistical person. Paste Select Format painter F' A 153 - 170 pOInts Student work demonstrates mastery of the objectives assessed by the Assignment. This is evidenced by at least the following: The selection of the statistical procedure(s) is/are the most appropriate ones for answering the questions; specifically, the correct ANOVA test method is selected for each question. The statistical procedurewas calculated correctly using SPSS. The interpretation of the SP$ output is correct and complete, including applying the (Sig. in SPSS) p-value to deternine null hypothesis rej action. The results of the statistical analyses are presented in easy to understand, non-statistical language that addresses the research question. SPSS output that is not needed in the solution is not included. Only appropriateSPSS output are included. Each step of the hypothesis testing procedure is included and Ho and Ha are clearly written. All aspects ofthetests are included and explained, including + LU hypoth esi s rej action. The results of the statistical analyses are presented in easy to understand, non-statistical language that addresses the research question. SPSS output that is not needed in the solution is not included. Only appropriateSPSS output are included. Each step ofthe hypothesis testing procedure is included and Ho and Ha are clearly written. All aspects ofthetests are included and explained, including the Post Hoc results and the interaction plot. Appropriate regression prediction equations are created and evaluated. Use alpha = .05 for this project. 1. Compare the different Sections (1, 2, and 3) of students in the Stat_Gradessav dataset to deternine if there is a statistically signicant difference in the average Total Points between the different class sections. In other words, just like at Kaplan, there are different sections of the same class The dataset Stat_Gradessav has data from three sections of statistics classes Be sure to state the hypothesis, state Ho and Ha, include and explain all SPSS results, and write nal conclusions for the full results of the test. Include Post Hoc results and the pLot. Be sure that your nal conclusions are written in corrmon terms for an average person to understand. (a) What is the hypothesis being tested? (b) What are Ho and Ha? (c) What statistical test will you run - and include all the SPSS outputs (including the plot and post hoc)? 7 F J L (d) Explain the full results for the statistical test that you ran above. Was a post hoc actually needed in this case? Why or why not? Does the Post Hoc conrm your results, expla'n? What doesthe plot tell you about the interaction, explain? (e) Write a full conclusion for all results on this test in a way that can be understood by a non- statistical person. This answer will be at least 100 words or more. 2 Extend the hypothesis from nunber one above. Compare the different sections in the Stat_Gradessav dataset m the genders to determine if there is a statistically signicant difference in the average Total Points between the different sections mi different genders Be sure to statethe hypothesis, state all Ho and Ha, include and explain all SPSS results, and write nal conclusions for the full results of the test. Include Post Hoc results, note any interactions and whether they are signicant, and include and eyqalain the plot. Be sure that your nal conclusions are written in common terms for an average person to understand. (a) What is the hypothesis being tested? + LU J (d) Explain the full results for the statistical test that you ran above. Was a post hoc actually needed in this case? Why or why not? Does the Post Hoc conrm your results, explain? What doesthe plot tell you about the interaction, explain? (e) Write a hill conclusion for all results on this test in a way that can be understood by a non- statistical person. This answer will be at least 100 words or more. 2 Extend the hypothesis from nurrber one above. Compare the different sections in the Stat_Gradessav dataset m the genders to determine if there is a statistically signicant difference in the average Totai Points between the different sections mi different genders Be sure to statethe hypothesis, state all Ho and Ha, include and explain all SPSS results, and write nal conclusions for the n" results of the test. Include Post Hoc results, note any interactions and whether they are signicant, and include and explain the plot. Be sure that your nal conclusions are written in common terms for an average person to understand. (a) What is the hypothesis being tested? (b) What are the set of Ho's and Ha's? (c) What statistical test will you run - and include all the SPSS outputs (including the plot and post hoc)? (d) Explain the full results of the statistical test you have run. Was a post hoc actually needed in this case? Why or why not? Does the Post Hoc conrm your test results, explain? What does the plot tell you about the interaction, explain? (e) Write a full conclusion for dl results on this test in a way that can be understood by a non- statistical person. This answer will be at least 100 words or more. 7 F J L 3. Prediction and Regression. If you recall from the Unit 3 Project, you looked at how to measure the relationship (correlation) between any two variables. You also learned that if two variables are strongly correlated (related) with each other, that one variable can be used to estimate or predict the other. The equation used to make this prediction iscalled a regression equation. Use thefollowing SPSS outputs to answer the questions. Thetwo variables in this case are Ouiz4 and Total Points. + LU J 3. Prediction and Regression. If you recall from the Unit 3 Project, you looked at how to measure the relationship (correlation) between any two variables. You also learned that if two variables are strongly correlated (related) with each other, that one variable can be used to estimate or predict the other. The equation used to make this prediction iscalled a regression equation. Use the following SPSS outputs to answer the questions. The two variables in this case are Quiz 4 and Total Points. m Sm Adjusted R Std. Ermr of Modal Square the Estimate \"mm mm a. Predictors: (Constant). Quiz 4 Points - Unslandardlzed Coefcients Coefcients 1 (Constant) 59.999 3.392 11.53! .IJDIJ a. DapandentVaabla: Total Paint: {a} What are the two variables that this question is investigating? Notice that the SPSS output above tells you that the r-value (called \"R\") is .775. Is this r-value strong enough to allow you to perform prediction between these two variables? Eanlain. (b) Using the "Coefficients\" 9338 output above, create the prediction equation. Remember that your independent or \"x" variable is Quiztl and your dependent or \"y\" variable is Total Points. Write the prediction equation here. 7 J L (c) Using the prediction equation that you created in part (b), predict the Total Points for a student with a Quiz 4 score of B. Show all work. + LU - ' Is. . Isr-va ue rong enoug o a owyou oper nrm pre-I Ion between these two variables? Explain. (b) Using the "Coefficients\" SPSS output above, create the prediction equation. Remerrber that your independent or \"1:\" variable is Quiz4 and your dependent or \"y\" variable is Total Points. Write the prediction equation here. J L (c) Using the prediction equation that you created in part (b), predict the Total Points for a student with a Quiz 4 score of 8. Show all work. 4. From the Stat_Grades.sav dataset, use Quiz 4 and Quiz 5 to answer these questions The question you will be considering here as you answer the questions below is \"is the score on Quiz 4 highly correlated to the score on Quiz 5 and can one be used to estimate or predict the other?\" (a) What is the correlation or relationship (r-value) between Quiz 4 and Quiz 5? Is it weak, medium, or strong? Is it strong enough to use for prediction? (b) Use SPSS and run a regression analysis on Quiz 4 and Quiz 5. Place the SP$ \"Coefcients\" output (only) here. (c) Use the SPSS output to create the regression (prediction) equation. Remen'ber, you are trying to predict how a student will perform on Quiz 5 based on how they do on Quiz 4. What isyour dependent (y) variable? What isyour independent (:0 variable? Writethe prediction equation here. (d) Use your prediction equation to predict how a student would perform on Quiz 5 if they got a 6 on Quiz 4. Show all work. Submitting your Project Make memmmismyourprqect andsatedtoyourcm'pmer. Whenwuarereaayto am: your cmetedn'qiect, clrhkm the quaboxmd Wete the steps below - Clickthe linkthat says \"Subnit an Assignment.\" - In the \"Submit to Basket\" menu, select Unit 9: Project. - In the \"Corrrnents\" eld, include your name and Unit 9 Project. - Clickthe \"Add Attachments\" button. - Follow the stepslisted to attach your Word document. - You should revisit the Dropbox to view any helpful feedback your instructor has left for you. - Make surethat you save a copy ofyour subm'tted and returned assignment
Step by Step Solution
There are 3 Steps involved in it
1 Expert Approved Answer
Step: 1 Unlock

Question Has Been Solved by an Expert!
Get step-by-step solutions from verified subject matter experts
Step: 2 Unlock
Step: 3 Unlock