

Question: I attached the answer key please show me the formulas to find the answer IN EXCEL please!!! Using the numbers in the chart below, calculate

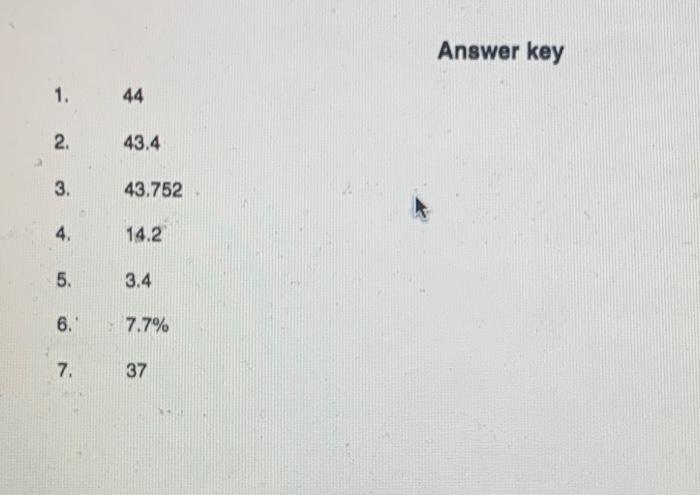
Using the numbers in the chart below, calculate the following: 1. Three-porlod moving average for Porlod 8. 2. Four period weighted moving average for Period 6 (weights: 4, 3, 2, and.1). Higher weights apply to the more recent periods. a Smoothed forecast for Porlod 6. (Uno a -3) 4. Moan Squared Error for Periods 1-5. 5. Moan Absolute Deviation for Perlods 1-5 6. Average percent error for Periods 1-5 7. Using linear regression in Excel, make a forecast for period 8 using trend projection Period Actual Demand Forecast Demand Error (You must calculate) Squared Error (You must calculate Absoluto Deviation (You must calculato) Porcent Error (You must calculato) 2 on to 48 45 47 45 52.69 48.97 45.82 46.76 45.36 4 5 40 The data in Excel format are available on Canvas Answer key 1. 44 2. 43.4 3. 43.752 4. 14.2 5. 3.4 6. 7.7% 7. 37
Step by Step Solution
There are 3 Steps involved in it

Get step-by-step solutions from verified subject matter experts