

Question: i can draw the graph but i dont know how to find p1 and p2 .... please help me in clear steps 3. (20 points)
i can draw the graph but i dont know how to find p1 and p2 .... please help me in clear steps 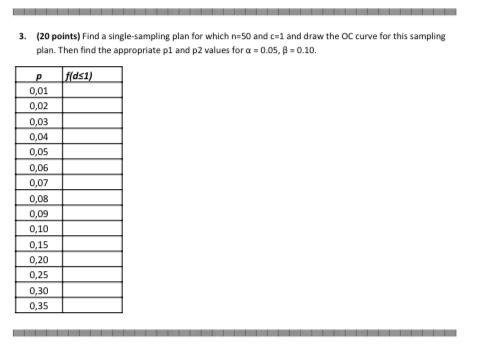
3. (20 points) Find a single-sampling plan for which n=50 and c=1 and draw the OC curve for this sampling plan. Then find the appropriate p1 and p2 values for =0.05,=0.10
Step by Step Solution
There are 3 Steps involved in it
1 Expert Approved Answer
Step: 1 Unlock

Question Has Been Solved by an Expert!
Get step-by-step solutions from verified subject matter experts
Step: 2 Unlock
Step: 3 Unlock