

Question: I cannot figure this problem out after several hours. Please help me! Average SD Party Hours 12 11 Number of Drinks 8 9 Correlation: r
I cannot figure this problem out after several hours. Please help me!
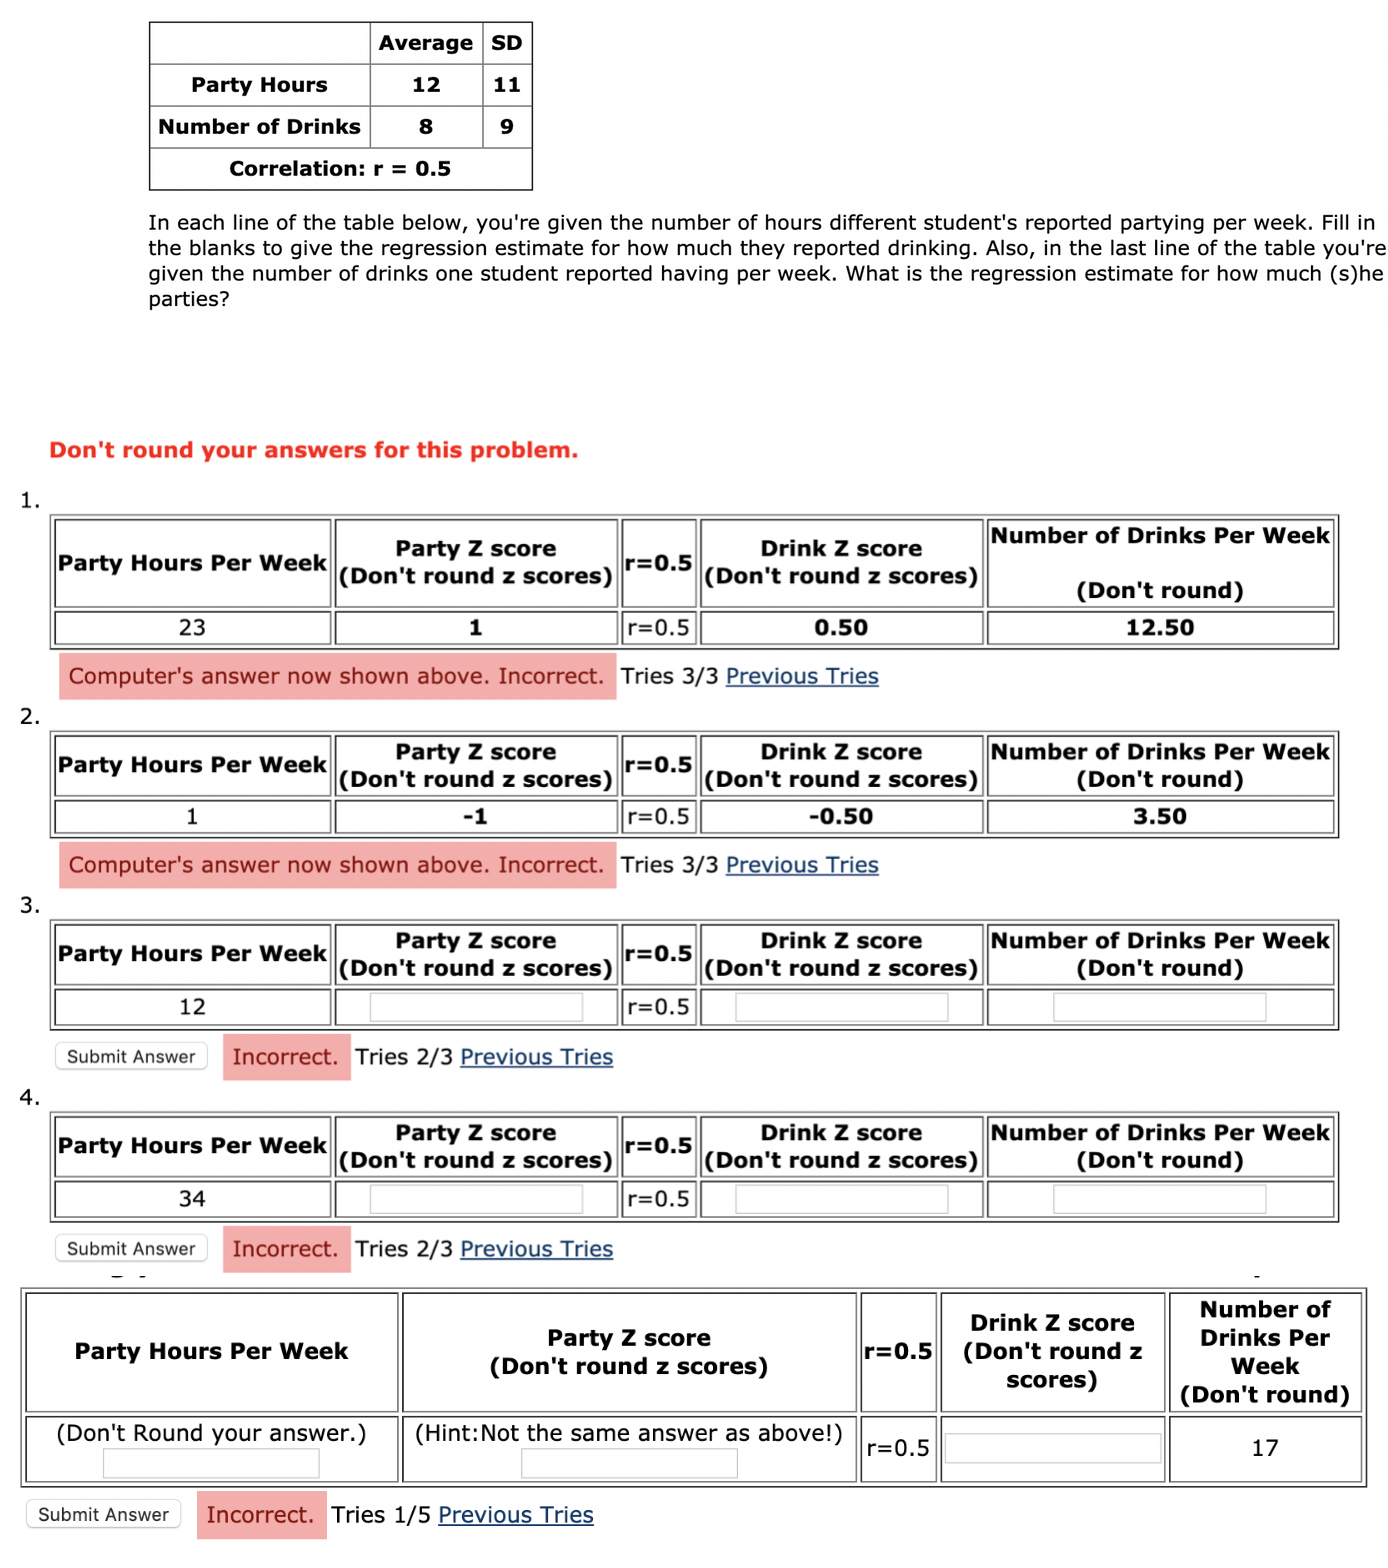
Average SD Party Hours 12 11 Number of Drinks 8 9 Correlation: r = 0.5 In each line of the table below, you're given the number of hours different student's reported partying per week. Fill in the blanks to give the regression estimate for how much they reported drinking. Also, in the last line of the table you're given the number of drinks one student reported having per week. What is the regression estimate for how much (s) he parties? Don't round your answers for this problem. 1. Number of Drinks Per Week Party Hours Per Week Party Z score (Don't round z scores) r=0.5 Drink Z score (Don't round z scores) (Don't round) 23 1 r=0.5 0.50 12.50 Computer's answer now shown above. Incorrect. Tries 3/3 Previous Tries 2. Party Hours Per Week Party Z score (Don't round z scores) r=0.5 Drink Z score Number of Drinks Per Week (Don't round z scores) (Don't round) 1 -1 r=0.5 -0.50 3.50 Computer's answer now shown above. Incorrect. Tries 3/3 Previous Tries 3 Party Hours Per Week Party Z score Drink Z score Number of Drinks Per Week (Don't round z scores) r=0.5 (Don't round z scores) Don't round) 12 r=0.5 Submit Answer Incorrect. Tries 2/3 Previous Tries 4 Party Hours Per Week Party Z score r=0.5 Drink Z score Number of Drinks Per Week (Don't round z scores) (Don't round z scores) (Don't round) 34 r=0.5 Submit Answer Incorrect. Tries 2/3 Previous Tries Drink Z score Number of Party Hours Per Week Party Z score (Don't round z scores) r=0.5 (Don't round z Drinks Per scores) Week (Don't round) Don't Round your answer.) (Hint: Not the same answer as above!) r=0.5 17 Submit Answer Incorrect. Tries 1/5 Previous Tries
Step by Step Solution
There are 3 Steps involved in it

Get step-by-step solutions from verified subject matter experts