

Question: Making Regression Estimates Two questions on our current survey are: About how many hours per week do you party? and About how many alcoholic beverages
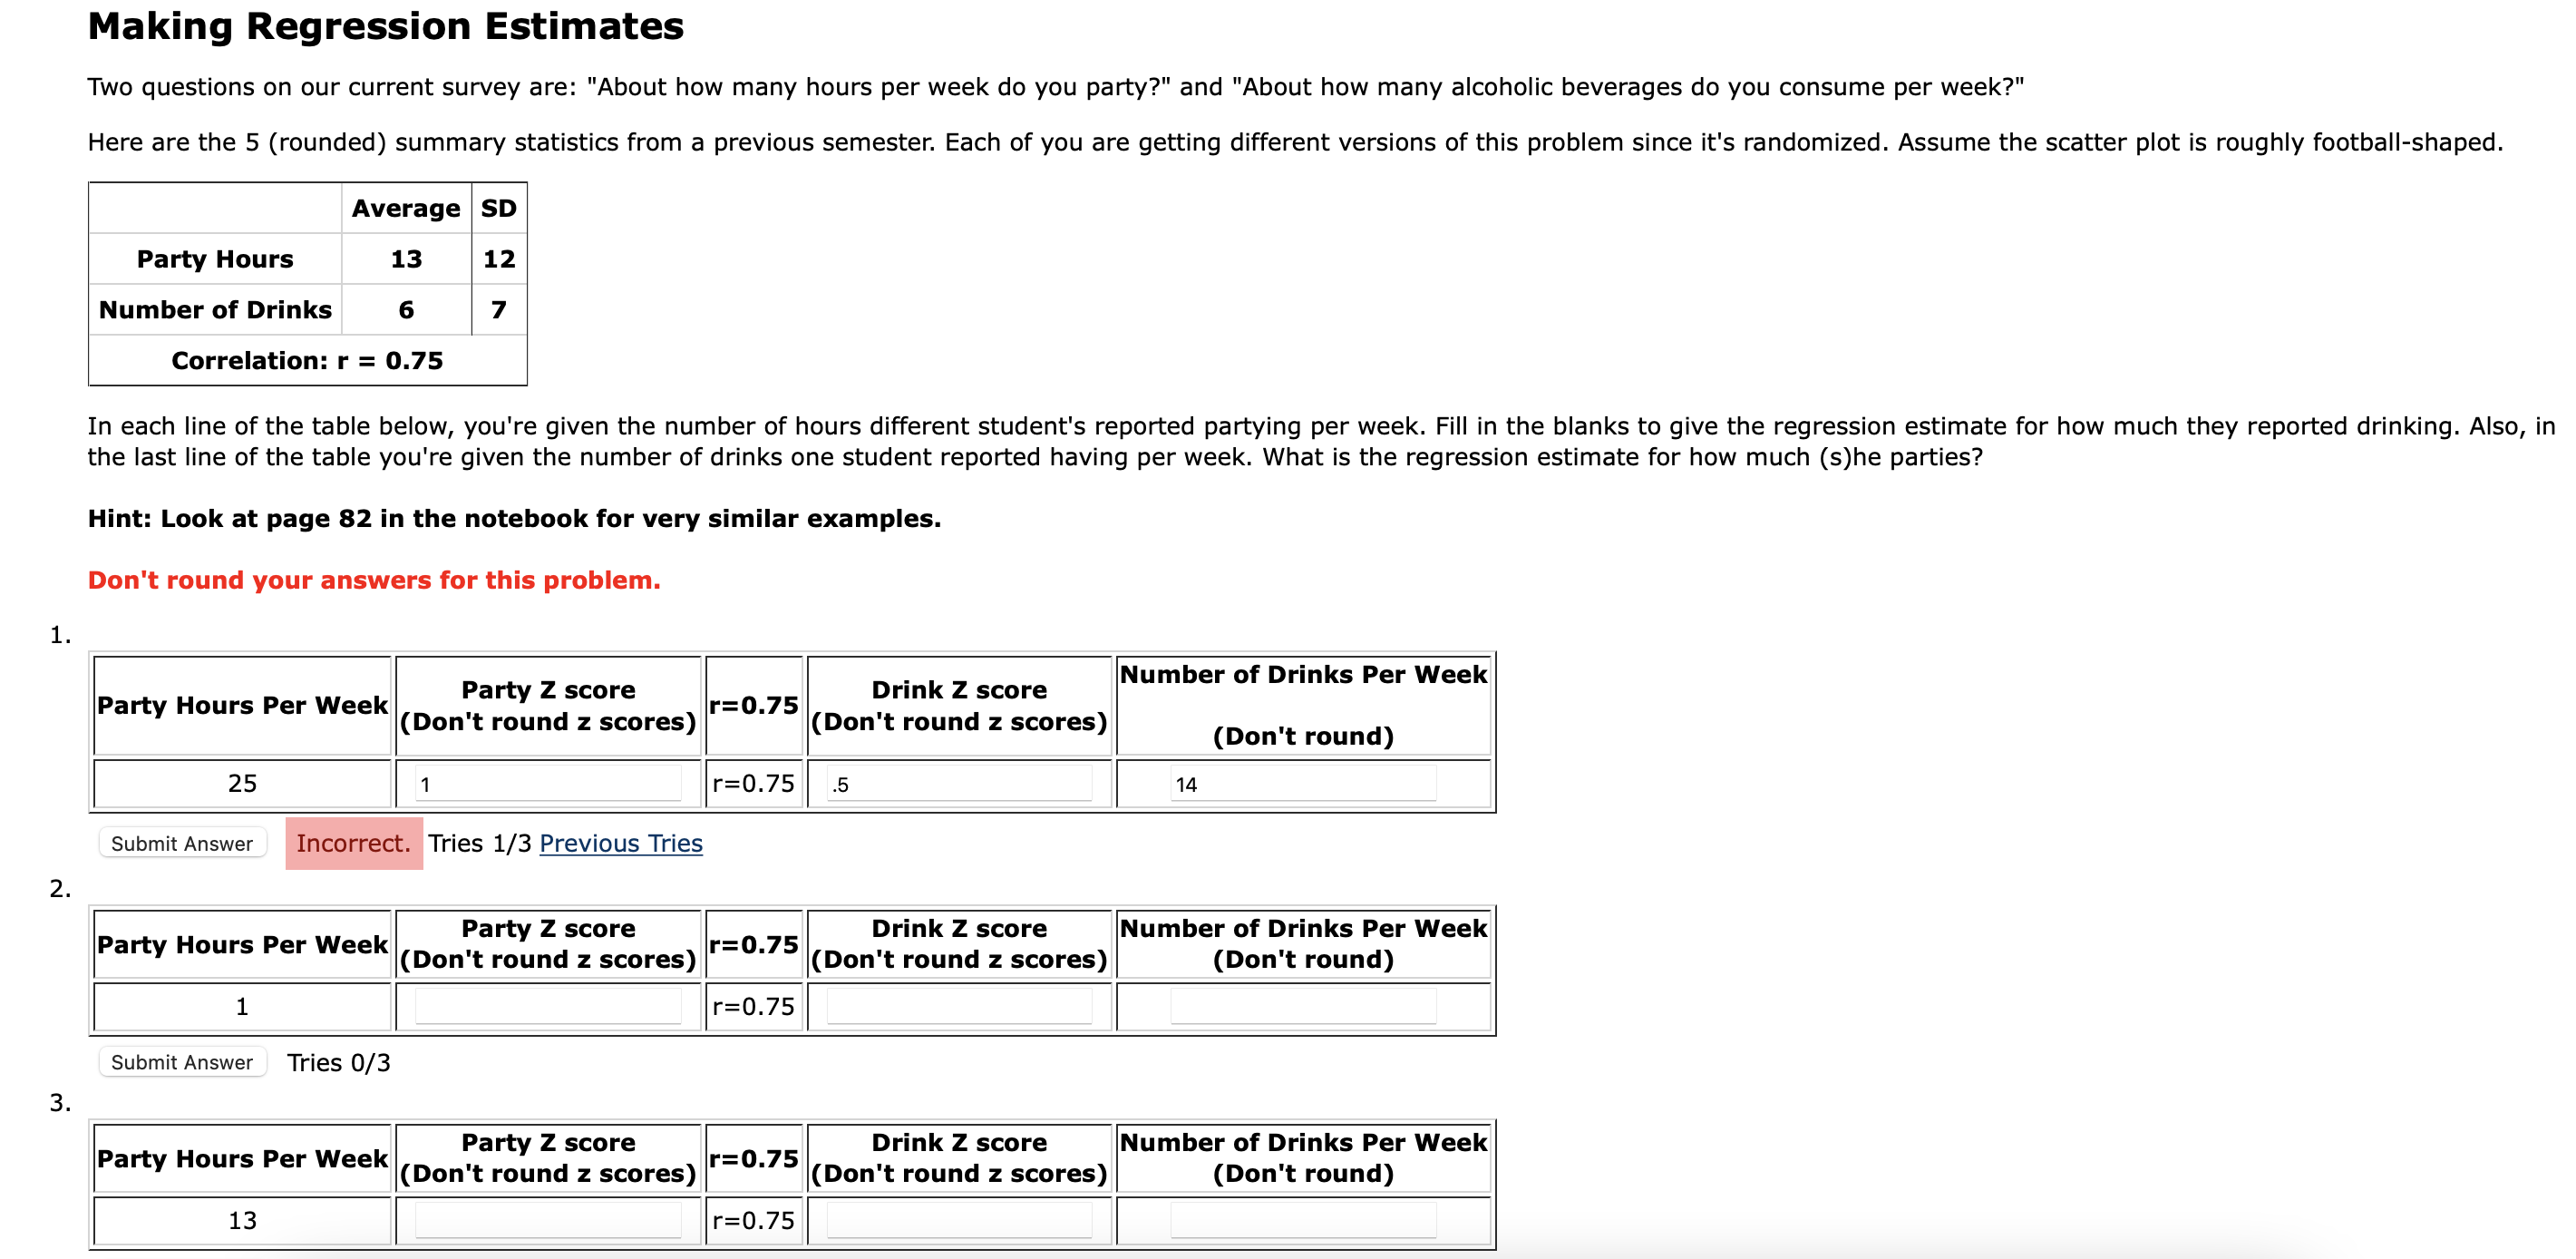
Making Regression Estimates Two questions on our current survey are: "About how many hours per week do you party?" and "About how many alcoholic beverages do you consume per week?" Here are the 5 (rounded) summary statistics from a previous semester. Each of you are getting different versions of this problem since it's randomized. Assume the scatter plot is roughly football-shaped. Average SD Party Hours 13 12 Number of Drinks 6 7 Correlation: r = 0.75 In each line of the table below, you're given the number of hours different student's reported partying per week. Fill in the blanks to give the regression estimate for how much they reported drinking. Also, in the last line of the table you're given the number of drinks one student reported having per week. what is the regression estimate for how much (s)he parties? Hint: Look at page 82 in the notebook for very similar examples. Don't round your answers for this problem. Party 2 score Drink 2 score Number of Drinks Per Week Party Hours Per Week (Don't round 2 scores) r=0.75 (Don't round 1 scores) (Don't round) 25 1 r=0.75 I .5 14 Submit Answer ,. > , , y' Tries 1/3 Previous Tries Party 2 score _ Drink 2 score Number of Drinks Per Week Party Hours Per Week (Don't round 2 scores) r0.75 (Don't round 2 scores) (Don't round) 1 r=0.75 I Submit Answer Tries 0/3 Party I score _ Drink 2 score Number of Drinks Per Week Party Hours Per Week (Don't round 2 scores) \"0'75 (Don't round 2 scores) (Don't round) 13 r=0.75 l
Step by Step Solution
There are 3 Steps involved in it

Get step-by-step solutions from verified subject matter experts