

Question: I cannot upload, I tried D Draft zoom Layout Layout Reader Navigation Pano Zoom to 100% Page Width Now Window Arrange Split 41 AGE HEIGHT
I cannot upload, I tried
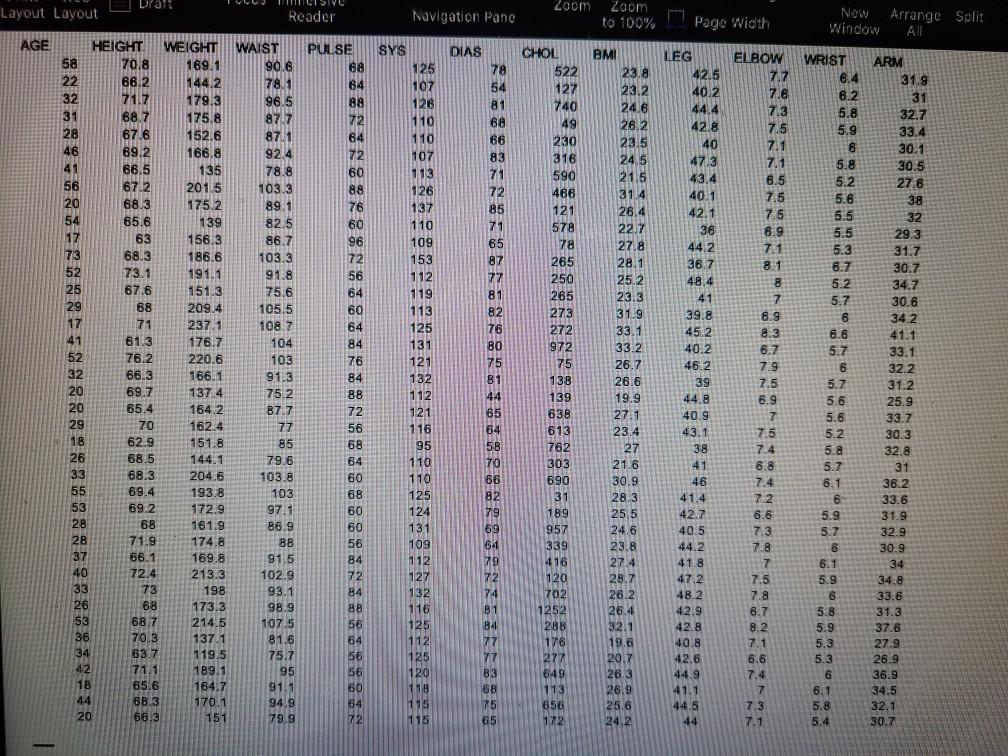
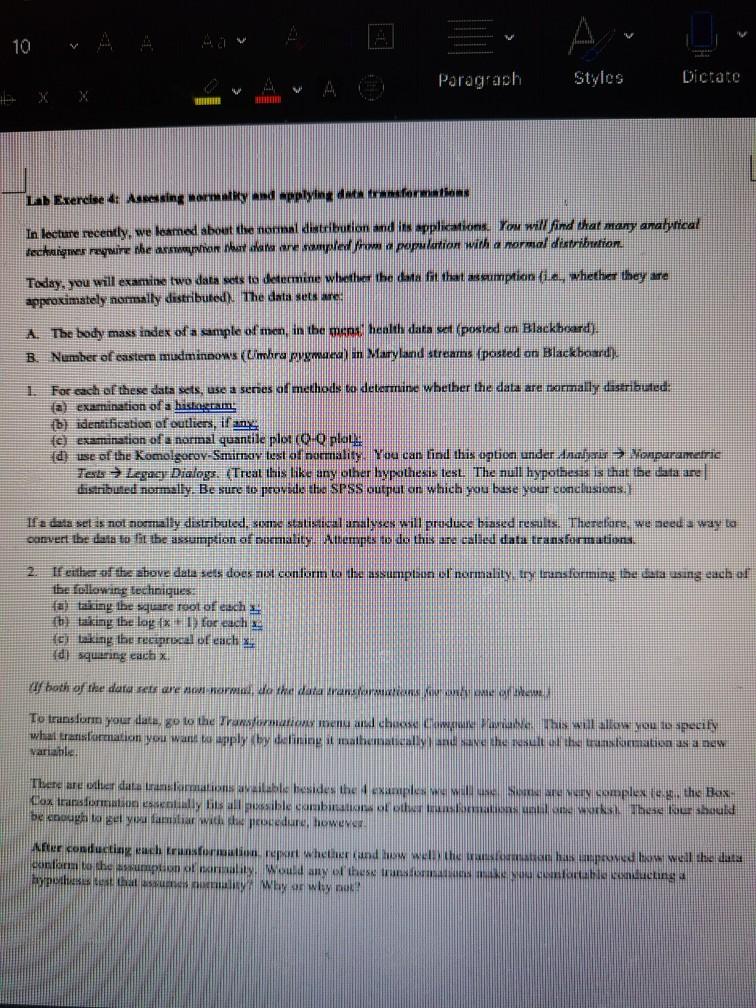
D Draft zoom Layout Layout Reader Navigation Pano Zoom to 100% Page Width Now Window Arrange Split 41 AGE HEIGHT WEIGHT WAIST 58 70.8 169.1 90.6 22 66.2 144.2 78.1 32 71.7 179.3 96.5 31 68.7 175.8 87.7 28 67.6 152.6 8711 46 69.2 166.8 92.4 66.5 135 78.8 56 67.2 201.5 103.3 20 68.3 175.2 89.1 54 65.6 139 82.5 17 63 156.3 86.7 73 68.3 186.6 103.3 52 73.1 191.1 91.8 25 67.6 151.3 75.6 68 209.4 105.5 71 237.1 108.7 41 61.3 176.7 104 52 76.2 220.6 103 32 66.3 166.1 91.3 20 69.7 137.4 75.2 20 65.4 164.2 87.7 70 162.4 77 18 62.9 151.8 85 26 68.5 144.1 79.6 33 68.3 204.6 103.8 55 69.4 193.8 103 53 172.9 97.1 28 161.9 RAS 86.9 71.9 174.8 88 37 66.1 169.8 91.5 40 40 20 22 72.4 213.3 102.9 33 73 198 93.1 26 6 68 173.3 98.9 HA BA 53 68.7 214.5 107.5 36 200 70.3 137.1 81.6 34 63.7 119.5 75.7 42 71.1 189.1 95 118 65.6 164.7 91.1 44 68.3 170.1 94.9 20 151 79.9 PULSE 68 64 88 72 64 72 60 88 76 60 96 72 56 64 60 64 84 76 84 88 72 56 68 64 60 68 60 60 56 84 72 84 SYS 125 107 126 110 110 107 113 126 137 110 109 153 112 119 113 125 131 121 132 112 121 116 95 110 110 125 124 131 109 DIAS 78 54 81 68 66 83 71 72 85 71 65 87 77 81 82 76 80 75 81 44 65 64 58 70 66 CHOL 522 127 740 49 230 316 590 466 121 578 78 265 250 265 273 272 972 75 138 139 638 613 762 303 690 31 BM 23.8 23.2 246 26.2 23.5 24.5 21.5 31.4 26.4 22.7 27.8 28.1 25.2 23.3 31.9 33.1 33.2 26.7 26.6 19.9 27.1 23.4 27 21.6 30.9 28.3 25.5 24.6 19 23.8 111 274 28.7 28.2 26.4 32.1 19.6 20.7 28.3 26.9 25.6 24.2 LEG 42.5 40.2 44.4 42.8 40 47.3 43.4 401 42.1 36 44.2 36.7 48.4 41 39.8 45.2 40.2 46.2 39 44.8 40.9 ELBOW 7.7 7.6 7.3 7.5 7.1 7.1 6.5 7.5 7.5 8.9 7.1 8.1 8 7 8.9 2.3 6.7 7.9 7.5 6.9 7 7.5 7.4 6.8 7.4 7.2 6.6 7.3 7.8 7 7.5 10 7.8 6.7 D. 8.2 7.1 6.6 7.4 7 7.3 7.1 WRIST 6.4 6.2 5.8 5.9 6 6 5.8 5.2 5.8 5.5 5.5 5.3 6.7 5.2 5.7 6 6.6 5.7 B 5.7 5.6 5.6 5.2 5.8 5.7 8.1 6 5.9 5.7 6 6.1 5.9 6 5.8 . 5.9 5.3 5.3 6 6.1 ARM 31.9 31 327 33.4 30.1 30.5 27.6 38 32 29.3 31.7 30.7 34.7 30.6 34.2 41.1 33.1 32.2 31.2 25.9 33.7 30.3 32.8 31 36.2 33.6 31.9 32.9 30.9 30.9 34 34.8 33.6 31.3 1.0 37.6 27.9 26.9 36.9 34.5 32.1 30.7 43.1 82 69.2 189 68 28 112 127 DEN 132 38 41 46 41.4 42.7 40.5 O 44.2 41.8 472 10:4 48.2 42.9 14 140 42.8 40.8 42.6 44.9 41.1 44.5 44 116 1 79 PUT 69 64 IN 79 BAN 72 74 B1 B4 77 77 B3 68 75 65 88 56 957 339 AM 416 120 702 444 1252 288 176 277 549 113 650 172 125 54 56 56 80 84 72 112 125 120 118 115 115 5.8 66.3 5.4 10 Paragrach Styles Dictate X La Exercise & Assessing mormatky and applying anormations In lecture recently, we leamed about the normal distribution and its applications. You will find that many analyrical techanges require the artwython Nhat how we samples for a population with a normal distribution Today, you will examine two data sets to determine whether the data fit that assaumption (ie whether they are approximately normally distributed). The data sets are: A. The body mass index of a sample of men, in the men health data se posted on Blackboard). B Number of eastern mudminnows (Limhra pygmaea un Maryland streams posted on Blackboard), 1 For each of these data sets, use a series of methods to determine whether the data are normally distributed: la examination of a histogram. b) identification of outliers, if any. (5Examination of a normal quantile plot Q plote: d) ase of the Komolgorov-Smity text of purmality. You can find this option under Anajares = Nonparametric Tests Legacy Dialogs. (Treat this like any other bypothesis test. The null hypothesis is that the data are] distributed normally. Be sure to provide ilia SPSS output on which you base your conclusions, If a data set is not normally distributed. un salaical analyses will produce biased results. Therefore, we need a way to convert the data to lil the assumption of purmality. Attempts to do this and called data transformations. If either of the above data sets does not conform to the assumption of normality to transforming the data using each of the following techniques {a) taking the square root of euch 1b) taking the log (1) for each ke taking the reciprocal of each di squering cach W both of the data sets are novor da the data transformans 9 To transform your data, go to the Transformation menu and chewe away. This will allow you to specify what transformation you want to apply by clining at mathematically and save the weselt ol the unstormation as a new variable There are other data transformations available besides the examples were complex tee. the Box Dox transformation essentially bits all possible combinations or semakin tulee vorst. These low should be enough to get you familiar with the procedure, however Are conducting such trunsformation report whether and bow well the wall has proved how well the data conform to the sumption of banality. Would any of these was formas ou umfertable conducting hypothesis test that usumes may Why on wlay nud! D Draft zoom Layout Layout Reader Navigation Pano Zoom to 100% Page Width Now Window Arrange Split 41 AGE HEIGHT WEIGHT WAIST 58 70.8 169.1 90.6 22 66.2 144.2 78.1 32 71.7 179.3 96.5 31 68.7 175.8 87.7 28 67.6 152.6 8711 46 69.2 166.8 92.4 66.5 135 78.8 56 67.2 201.5 103.3 20 68.3 175.2 89.1 54 65.6 139 82.5 17 63 156.3 86.7 73 68.3 186.6 103.3 52 73.1 191.1 91.8 25 67.6 151.3 75.6 68 209.4 105.5 71 237.1 108.7 41 61.3 176.7 104 52 76.2 220.6 103 32 66.3 166.1 91.3 20 69.7 137.4 75.2 20 65.4 164.2 87.7 70 162.4 77 18 62.9 151.8 85 26 68.5 144.1 79.6 33 68.3 204.6 103.8 55 69.4 193.8 103 53 172.9 97.1 28 161.9 RAS 86.9 71.9 174.8 88 37 66.1 169.8 91.5 40 40 20 22 72.4 213.3 102.9 33 73 198 93.1 26 6 68 173.3 98.9 HA BA 53 68.7 214.5 107.5 36 200 70.3 137.1 81.6 34 63.7 119.5 75.7 42 71.1 189.1 95 118 65.6 164.7 91.1 44 68.3 170.1 94.9 20 151 79.9 PULSE 68 64 88 72 64 72 60 88 76 60 96 72 56 64 60 64 84 76 84 88 72 56 68 64 60 68 60 60 56 84 72 84 SYS 125 107 126 110 110 107 113 126 137 110 109 153 112 119 113 125 131 121 132 112 121 116 95 110 110 125 124 131 109 DIAS 78 54 81 68 66 83 71 72 85 71 65 87 77 81 82 76 80 75 81 44 65 64 58 70 66 CHOL 522 127 740 49 230 316 590 466 121 578 78 265 250 265 273 272 972 75 138 139 638 613 762 303 690 31 BM 23.8 23.2 246 26.2 23.5 24.5 21.5 31.4 26.4 22.7 27.8 28.1 25.2 23.3 31.9 33.1 33.2 26.7 26.6 19.9 27.1 23.4 27 21.6 30.9 28.3 25.5 24.6 19 23.8 111 274 28.7 28.2 26.4 32.1 19.6 20.7 28.3 26.9 25.6 24.2 LEG 42.5 40.2 44.4 42.8 40 47.3 43.4 401 42.1 36 44.2 36.7 48.4 41 39.8 45.2 40.2 46.2 39 44.8 40.9 ELBOW 7.7 7.6 7.3 7.5 7.1 7.1 6.5 7.5 7.5 8.9 7.1 8.1 8 7 8.9 2.3 6.7 7.9 7.5 6.9 7 7.5 7.4 6.8 7.4 7.2 6.6 7.3 7.8 7 7.5 10 7.8 6.7 D. 8.2 7.1 6.6 7.4 7 7.3 7.1 WRIST 6.4 6.2 5.8 5.9 6 6 5.8 5.2 5.8 5.5 5.5 5.3 6.7 5.2 5.7 6 6.6 5.7 B 5.7 5.6 5.6 5.2 5.8 5.7 8.1 6 5.9 5.7 6 6.1 5.9 6 5.8 . 5.9 5.3 5.3 6 6.1 ARM 31.9 31 327 33.4 30.1 30.5 27.6 38 32 29.3 31.7 30.7 34.7 30.6 34.2 41.1 33.1 32.2 31.2 25.9 33.7 30.3 32.8 31 36.2 33.6 31.9 32.9 30.9 30.9 34 34.8 33.6 31.3 1.0 37.6 27.9 26.9 36.9 34.5 32.1 30.7 43.1 82 69.2 189 68 28 112 127 DEN 132 38 41 46 41.4 42.7 40.5 O 44.2 41.8 472 10:4 48.2 42.9 14 140 42.8 40.8 42.6 44.9 41.1 44.5 44 116 1 79 PUT 69 64 IN 79 BAN 72 74 B1 B4 77 77 B3 68 75 65 88 56 957 339 AM 416 120 702 444 1252 288 176 277 549 113 650 172 125 54 56 56 80 84 72 112 125 120 118 115 115 5.8 66.3 5.4 10 Paragrach Styles Dictate X La Exercise & Assessing mormatky and applying anormations In lecture recently, we leamed about the normal distribution and its applications. You will find that many analyrical techanges require the artwython Nhat how we samples for a population with a normal distribution Today, you will examine two data sets to determine whether the data fit that assaumption (ie whether they are approximately normally distributed). The data sets are: A. The body mass index of a sample of men, in the men health data se posted on Blackboard). B Number of eastern mudminnows (Limhra pygmaea un Maryland streams posted on Blackboard), 1 For each of these data sets, use a series of methods to determine whether the data are normally distributed: la examination of a histogram. b) identification of outliers, if any. (5Examination of a normal quantile plot Q plote: d) ase of the Komolgorov-Smity text of purmality. You can find this option under Anajares = Nonparametric Tests Legacy Dialogs. (Treat this like any other bypothesis test. The null hypothesis is that the data are] distributed normally. Be sure to provide ilia SPSS output on which you base your conclusions, If a data set is not normally distributed. un salaical analyses will produce biased results. Therefore, we need a way to convert the data to lil the assumption of purmality. Attempts to do this and called data transformations. If either of the above data sets does not conform to the assumption of normality to transforming the data using each of the following techniques {a) taking the square root of euch 1b) taking the log (1) for each ke taking the reciprocal of each di squering cach W both of the data sets are novor da the data transformans 9 To transform your data, go to the Transformation menu and chewe away. This will allow you to specify what transformation you want to apply by clining at mathematically and save the weselt ol the unstormation as a new variable There are other data transformations available besides the examples were complex tee. the Box Dox transformation essentially bits all possible combinations or semakin tulee vorst. These low should be enough to get you familiar with the procedure, however Are conducting such trunsformation report whether and bow well the wall has proved how well the data conform to the sumption of banality. Would any of these was formas ou umfertable conducting hypothesis test that usumes may Why on wlay nudStep by Step Solution
There are 3 Steps involved in it
1 Expert Approved Answer
Step: 1 Unlock

Question Has Been Solved by an Expert!
Get step-by-step solutions from verified subject matter experts
Step: 2 Unlock
Step: 3 Unlock