

Question: i cant figure out this python code and my professor is no help. ill include picture of the excel files that need to be extracted
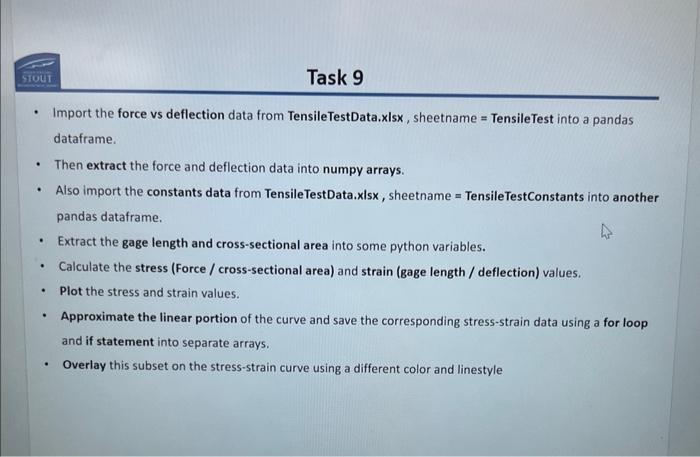
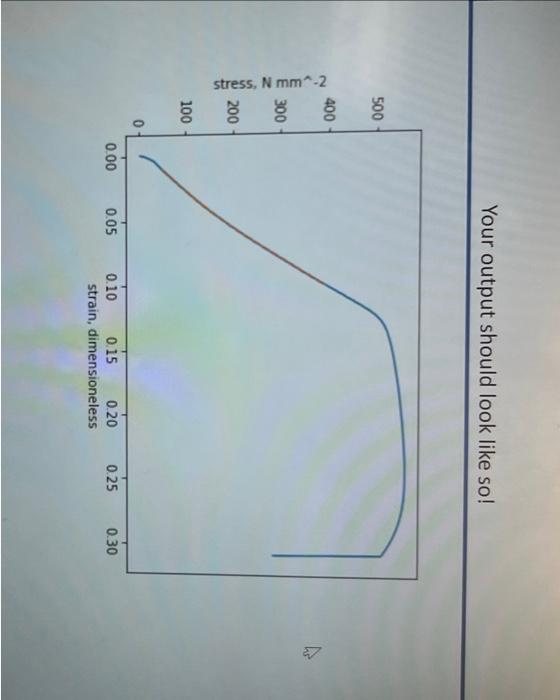
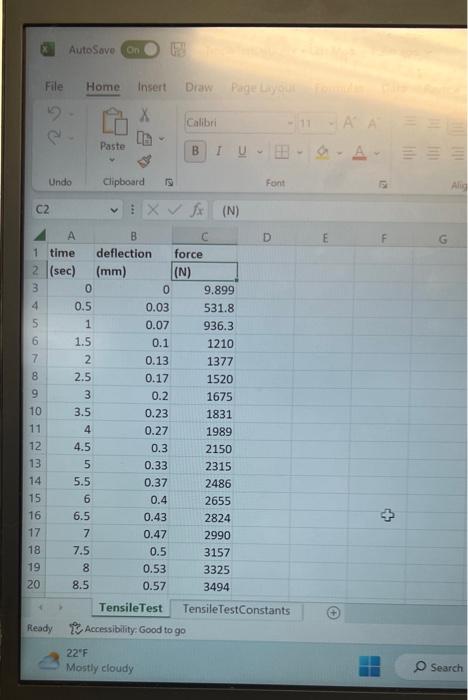
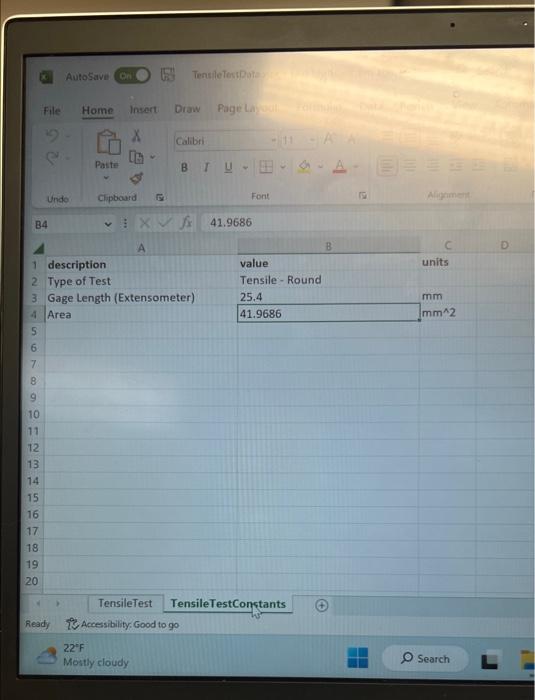
- Import the force vs deflection data from TensileTestData.xlsx, sheetname = TensileTest into a pandas dataframe. - Then extract the force and deflection data into numpy arrays. - Also import the constants data from TensileTestData.xlsx, sheetname = TensileTestConstants into another pandas dataframe. - Extract the gage length and cross-sectional area into some python variables. - Calculate the stress (Force / cross-sectional area) and strain (gage length / deflection) values. - Plot the stress and strain values. - Approximate the linear portion of the curve and save the corresponding stress-strain data using a for loop and if statement into separate arrays. - Overlay this subset on the stress-strain curve using a different color and linestyle Your output should look like so! B. Autosove (k) Autosavi (cin B. File Home Insert Draw Page Lai 677 78910111213141516 Ready IS Accessibility, Good to go 22F Mostly cloudy
Step by Step Solution
There are 3 Steps involved in it

Get step-by-step solutions from verified subject matter experts