

Question: i. Construct a mean control chart for this process of checking-in with three-sigma (z = 3) limits. ii. Plot the sample means into the control
i. Construct a mean control chart for this process of checking-in with three-sigma (z = 3) limits.
ii. Plot the sample means into the control chart
iii. Is the process in control?
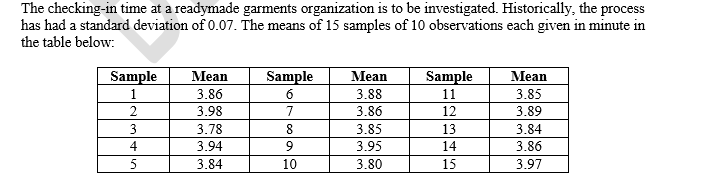
The checking-in time at a readymade garments organization is to be investigated. Historically, the process has had a standard deviation of 0.07. The means of 15 samples of 10 observations each given in minute in the table below: Sample 1 2 3 4 5 Mean 3.86 3.98 3.78 3.94 3.84 Sample 6 7 8 9 10 Mean 3.88 3.86 3.85 3.95 3.80 Sample 11 12 13 14 15 Mean 3.85 3.89 3.84 3.86 3.97Step by Step Solution
There are 3 Steps involved in it
1 Expert Approved Answer
Step: 1 Unlock

Question Has Been Solved by an Expert!
Get step-by-step solutions from verified subject matter experts
Step: 2 Unlock
Step: 3 Unlock