

Question: I could use some help calculating the items in yellow. Thank you. Using the spreadsheet and the balance sheet, income statement, and cash flow statement
I could use some help calculating the items in yellow. Thank you.
Using the spreadsheet and the balance sheet, income statement, and cash flow statement for your chosen company, calculate the financial ratios for the most recent fiscal quarter. Then, compare those ratios with the same ratios for the same fiscal quarter from one year prior in Mergent Online, and analyze your results.
Specifically, you must address the following rubric criteria:
- Financial Calculations: Calculate accurate financial ratios to assess the businesss current financial health. Specifically, calculate the following ratios:
- Working capital
- Current ratio
- Debt ratio
- Earnings per share
- Price/earnings ratio
- Total asset turnover ratio
- Financial leverage
- Net profit margin
- Return on assets
- Return on equity
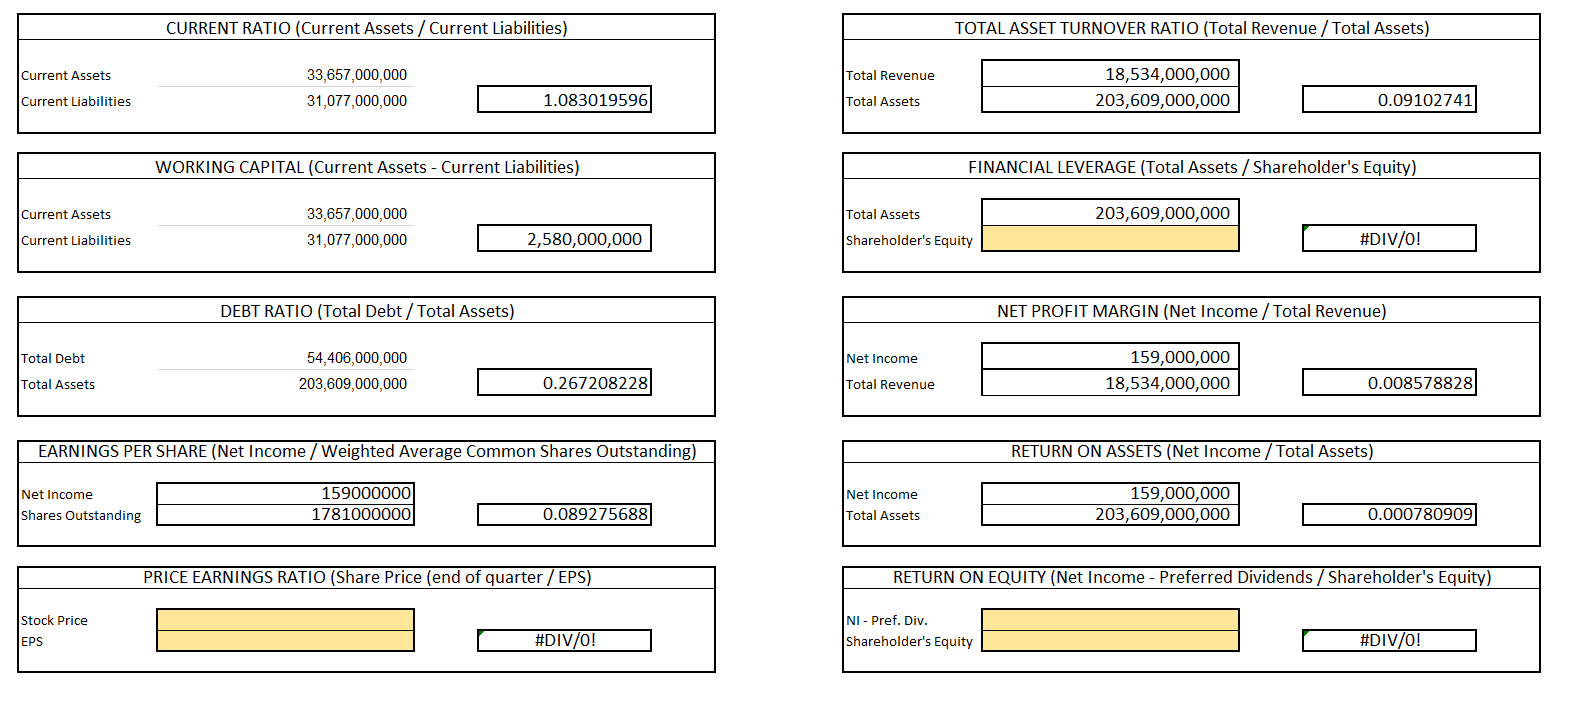
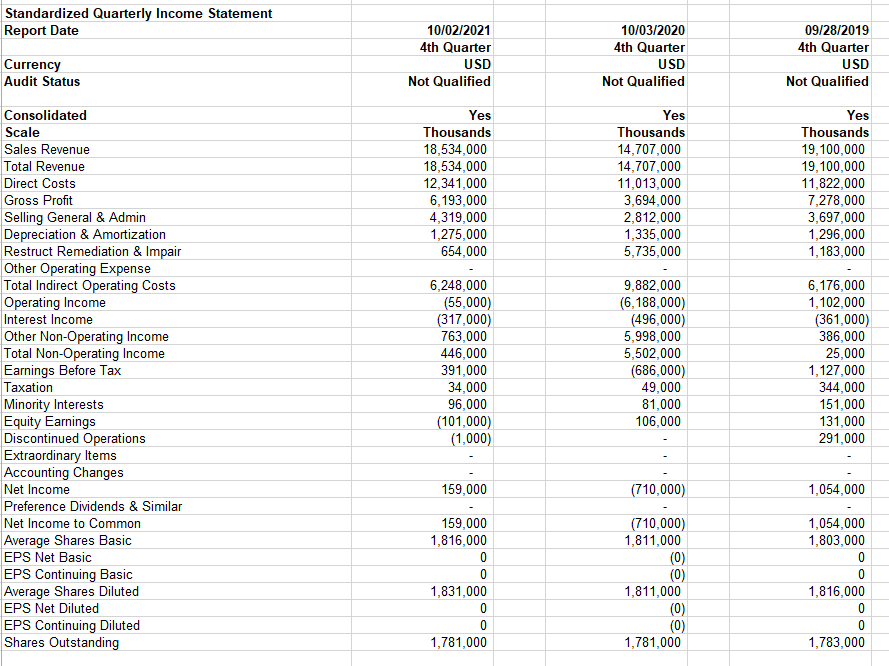
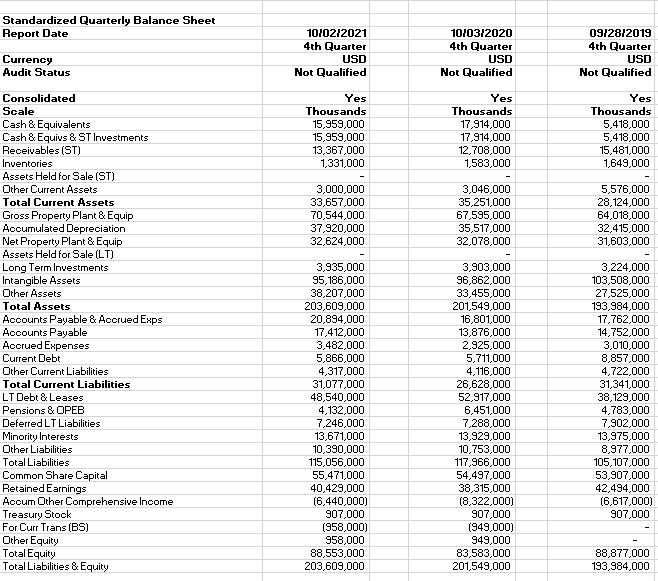
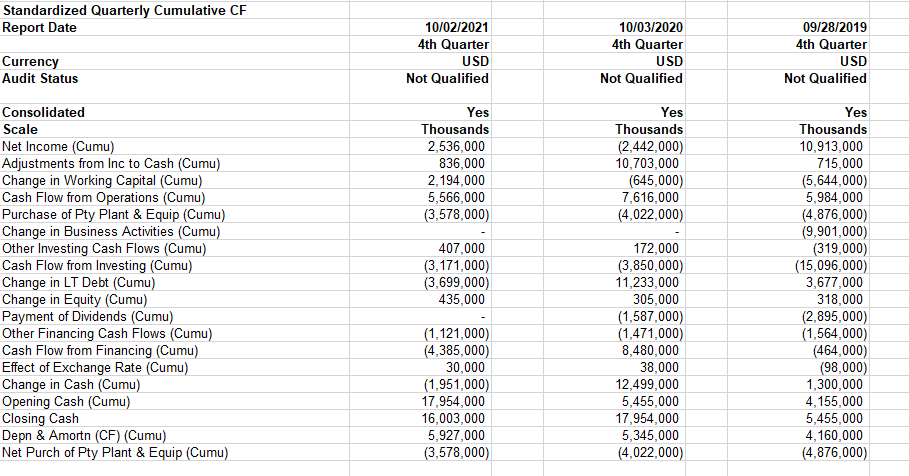
CURRENT RATIO (Current Assets / Current Liabilities) TOTAL ASSET TURNOVER RATIO (Total Revenue / Total Assets) Current Assets Total Revenue 33,657,000,000 31,077,000,000 18,534,000,000 203,609,000,000 Current Liabilities 1.083019596 Total Assets 0.09102741 WORKING CAPITAL (Current Assets - Current Liabilities) FINANCIAL LEVERAGE (Total Assets / Shareholder's Equity) Current Assets Total Assets 203,609,000,000 33,657,000,000 31,077,000,000 Current Liabilities 2,580,000,000 Shareholder's Equity #DIV/0! DEBT RATIO (Total Debt / Total Assets) NET PROFIT MARGIN (Net Income / Total Revenue) Total Debt Net Income 54,406,000,000 203,609,000,000 159,000,000 18,534,000,000 Total Assets 0.267208228 Total Revenue 0.008578828 EARNINGS PER SHARE (Net Income / Weighted Average Common Shares Outstanding) RETURN ON ASSETS (Net Income / Total Assets) Net Income shares Outstanding 159000000 1781000000 Net Income Total Assets 159,000,000 203,609,000,000 0.089275688 0.000780909 PRICE EARNINGS RATIO (Share Price (end of quarter/EPS) RETURN ON EQUITY (Net Income - Preferred Dividends / Shareholder's Equity) Stock Price EPS #DIV/0! NI - Pref. Div. Shareholder's Equity #DIV/0! Standardized Quarterly Income Statement Report Date Currency Audit Status 10/02/2021 4th Quarter USD Not Qualified 10/03/2020 4th Quarter USD Not Qualified 09/28/2019 4th Quarter USD Not Qualified Yes Thousands 18,534,000 18,534,000 12,341,000 6,193,000 4,319,000 1,275,000 654,000 Yes Thousands 14,707,000 14,707,000 11,013,000 3,694,000 2,812,000 1,335,000 5,735,000 Yes Thousands 19,100,000 19,100,000 11,822,000 7,278,000 3,697,000 1,296,000 1,183,000 Consolidated Scale Sales Revenue Total Revenue Direct Costs Gross Profit Selling General & Admin Depreciation & Amortization Restruct Remediation & Impair Other Operating Expense Total Indirect Operating costs Operating Income Interest Income Other Non-Operating Income Total Non-Operating Income Earnings Before Tax Taxation Minority Interests Equity Earnings Discontinued Operations Extraordinary Items Accounting Changes Net Income Preference Dividends & Similar Net Income to Common Average Shares Basic EPS Net Basic EPS Continuing Basic Average Shares Diluted EPS Net Diluted EPS Continuing Diluted Shares Outstanding 6,248,000 (55,000) (317,000) 763,000 446,000 391,000 34,000 96,000 (101,000) (1,000) 9,882,000 (6,188,000) (496,000) 5,998,000 5,502,000 (686,000) 49,000 81,000 106,000 6,176,000 1,102,000 (361,000) 386,000 25,000 1,127,000 344,000 151,000 131,000 291,000 159,000 (710,000) 1,054,000 159,000 1,816,000 0 0 1,831,000 0 0 1,781,000 (710,000) 1,811,000 (0) (0) 1,811,000 (0) (0) 1,781,000 1,054,000 1,803,000 0 0 1,816,000 0 0 1,783,000 Standardized Quarterly Balance Sheet Report Date Currency Audit Status 10/02/2021 4th Quarter USD Not Qualified 10/03/2020 4th Quarter USD Not Qualified 09/28/2019 4th Quarter USD Not Qualified Yes Thousands 15,959,000 15,959,000 13,367,000 1,331,000 Yes Thousands 17,914,000 17.914,000 12,708,000 1,583,000 Yes Thousands 5,418,000 5,418,000 15,481,000 1,649,000 3,000,000 33,657,000 70,544,000 37,920,000 32,624,000 3,046,000 35,251,000 67,595,000 35,517,000 32,078,000 5,576,000 28,124,000 64,018,000 32,415,000 31,603,000 Consolidated Scale Cash & Equivalents Cash & Equivs & ST Investments Receivables (ST) Inventories Assets Held for Sale (ST) Other Current Assets Total Current Assets Gross Property Plant & Equip Accumulated Depreciation Net Property Plant & Equip Assets Held for Sale (LT) Long Term Investments Intangible Assets Other Assets Total Assets Accounts Payable & Accrued Exps Accounts Payable Accrued Expenses Current Debt Other Current Liabilities Total Current Liabilities LT Debt & Leases Pensions & OPEB Deferred LT Liabilities Minority Interests Other Liabilities Total Liabilities Common Share Capital Retained Earnings Accum Other Comprehensive Income Treasury Stock For Curr Trans (BS) Other Equity Total Equity Total Liabilities & Equity 3,935,000 95, 186,000 38,207,000 203,609,000 20,894,000 17,412,000 3,482,000 5,866,000 4,317,000 31,077,000 48,540,000 4,132,000 7,246,000 13,671,000 10,390,000 115,056,000 55,471,000 40,429,000 (6,440,000) 907,000 (958,000) 958,000 88,553,000 203,609,000 3,903,000 96,862,000 33,455,000 201,549,000 16,801,000 13,876,000 2,925,000 5,711,000 4,116,000 26,628,000 52,917,000 6,451,000 7,288,000 13,929,000 10,753,000 117,966,000 54,497,000 38,315,000 (8,322,000) 907,000 (949,000) 949,000 83,583,000 201,549,000 3,224,000 103,508,000 27,525,000 193,984,000 17,762,000 14,752,000 3,010,000 8,857,000 4,722,000 31,341,000 38,129,000 4,783,000 7,902,000 13,975,000 8,977,000 105,107,000 53,907,000 42,494,000 (6,617,000) 907,000 88,877,000 193,984,000 Standardized Quarterly Cumulative CF Report Date 10/02/2021 4th Quarter USD Not Qualified 10/03/2020 4th Quarter USD Not Qualified 09/28/2019 4th Quarter USD Not Qualified Currency Audit Status Yes Thousands 2,536,000 836,000 2,194,000 5,566,000 (3,578,000) Yes Thousands (2,442,000) 10,703,000 (645,000) 7,616,000 (4,022,000) Consolidated Scale Net Income (Cumu) Adjustments from Inc to Cash (Cumu) Change in Working Capital (Cumu) Cash Flow from Operations (Cumu) Purchase of Pty Plant & Equip (Cumu) Change in Business Activities (Cumu) Other Investing Cash Flows (Cumu) Cash Flow from Investing (Cumu) Change in LT Debt (Cumu) Change in Equity (Cumu) Payment of Dividends (Cumu) Other Financing Cash Flows (Cumu) Cash Flow from Financing (Cumu) Effect of Exchange Rate (Cumu) Change in Cash (Cumu) Opening Cash (Cumu) Closing Cash Depn & Amortn (CF) (Cumu) Net Purch of Pty Plant & Equip (Cumu) 407,000 (3,171,000) (3,699,000) 435,000 Yes Thousands 10,913,000 715,000 (5,644,000) 5,984,000 (4,876,000) (9,901,000) (319,000) (15,096,000) 3,677,000 318,000 (2,895,000) (1,564,000) (464,000) (98,000) 1,300,000 4,155,000 5,455,000 4,160,000 (4,876,000) 172,000 (3,850,000) 11,233,000 305,000 (1,587,000) (1,471,000) 8,480,000 38,000 12,499,000 5,455,000 17,954,000 5,345,000 (4,022,000) (1,121,000) (4,385,000) 30,000 (1,951,000) 17,954,000 16,003,000 5,927,000 (3,578,000) CURRENT RATIO (Current Assets / Current Liabilities) TOTAL ASSET TURNOVER RATIO (Total Revenue / Total Assets) Current Assets Total Revenue 33,657,000,000 31,077,000,000 18,534,000,000 203,609,000,000 Current Liabilities 1.083019596 Total Assets 0.09102741 WORKING CAPITAL (Current Assets - Current Liabilities) FINANCIAL LEVERAGE (Total Assets / Shareholder's Equity) Current Assets Total Assets 203,609,000,000 33,657,000,000 31,077,000,000 Current Liabilities 2,580,000,000 Shareholder's Equity #DIV/0! DEBT RATIO (Total Debt / Total Assets) NET PROFIT MARGIN (Net Income / Total Revenue) Total Debt Net Income 54,406,000,000 203,609,000,000 159,000,000 18,534,000,000 Total Assets 0.267208228 Total Revenue 0.008578828 EARNINGS PER SHARE (Net Income / Weighted Average Common Shares Outstanding) RETURN ON ASSETS (Net Income / Total Assets) Net Income shares Outstanding 159000000 1781000000 Net Income Total Assets 159,000,000 203,609,000,000 0.089275688 0.000780909 PRICE EARNINGS RATIO (Share Price (end of quarter/EPS) RETURN ON EQUITY (Net Income - Preferred Dividends / Shareholder's Equity) Stock Price EPS #DIV/0! NI - Pref. Div. Shareholder's Equity #DIV/0! Standardized Quarterly Income Statement Report Date Currency Audit Status 10/02/2021 4th Quarter USD Not Qualified 10/03/2020 4th Quarter USD Not Qualified 09/28/2019 4th Quarter USD Not Qualified Yes Thousands 18,534,000 18,534,000 12,341,000 6,193,000 4,319,000 1,275,000 654,000 Yes Thousands 14,707,000 14,707,000 11,013,000 3,694,000 2,812,000 1,335,000 5,735,000 Yes Thousands 19,100,000 19,100,000 11,822,000 7,278,000 3,697,000 1,296,000 1,183,000 Consolidated Scale Sales Revenue Total Revenue Direct Costs Gross Profit Selling General & Admin Depreciation & Amortization Restruct Remediation & Impair Other Operating Expense Total Indirect Operating costs Operating Income Interest Income Other Non-Operating Income Total Non-Operating Income Earnings Before Tax Taxation Minority Interests Equity Earnings Discontinued Operations Extraordinary Items Accounting Changes Net Income Preference Dividends & Similar Net Income to Common Average Shares Basic EPS Net Basic EPS Continuing Basic Average Shares Diluted EPS Net Diluted EPS Continuing Diluted Shares Outstanding 6,248,000 (55,000) (317,000) 763,000 446,000 391,000 34,000 96,000 (101,000) (1,000) 9,882,000 (6,188,000) (496,000) 5,998,000 5,502,000 (686,000) 49,000 81,000 106,000 6,176,000 1,102,000 (361,000) 386,000 25,000 1,127,000 344,000 151,000 131,000 291,000 159,000 (710,000) 1,054,000 159,000 1,816,000 0 0 1,831,000 0 0 1,781,000 (710,000) 1,811,000 (0) (0) 1,811,000 (0) (0) 1,781,000 1,054,000 1,803,000 0 0 1,816,000 0 0 1,783,000 Standardized Quarterly Balance Sheet Report Date Currency Audit Status 10/02/2021 4th Quarter USD Not Qualified 10/03/2020 4th Quarter USD Not Qualified 09/28/2019 4th Quarter USD Not Qualified Yes Thousands 15,959,000 15,959,000 13,367,000 1,331,000 Yes Thousands 17,914,000 17.914,000 12,708,000 1,583,000 Yes Thousands 5,418,000 5,418,000 15,481,000 1,649,000 3,000,000 33,657,000 70,544,000 37,920,000 32,624,000 3,046,000 35,251,000 67,595,000 35,517,000 32,078,000 5,576,000 28,124,000 64,018,000 32,415,000 31,603,000 Consolidated Scale Cash & Equivalents Cash & Equivs & ST Investments Receivables (ST) Inventories Assets Held for Sale (ST) Other Current Assets Total Current Assets Gross Property Plant & Equip Accumulated Depreciation Net Property Plant & Equip Assets Held for Sale (LT) Long Term Investments Intangible Assets Other Assets Total Assets Accounts Payable & Accrued Exps Accounts Payable Accrued Expenses Current Debt Other Current Liabilities Total Current Liabilities LT Debt & Leases Pensions & OPEB Deferred LT Liabilities Minority Interests Other Liabilities Total Liabilities Common Share Capital Retained Earnings Accum Other Comprehensive Income Treasury Stock For Curr Trans (BS) Other Equity Total Equity Total Liabilities & Equity 3,935,000 95, 186,000 38,207,000 203,609,000 20,894,000 17,412,000 3,482,000 5,866,000 4,317,000 31,077,000 48,540,000 4,132,000 7,246,000 13,671,000 10,390,000 115,056,000 55,471,000 40,429,000 (6,440,000) 907,000 (958,000) 958,000 88,553,000 203,609,000 3,903,000 96,862,000 33,455,000 201,549,000 16,801,000 13,876,000 2,925,000 5,711,000 4,116,000 26,628,000 52,917,000 6,451,000 7,288,000 13,929,000 10,753,000 117,966,000 54,497,000 38,315,000 (8,322,000) 907,000 (949,000) 949,000 83,583,000 201,549,000 3,224,000 103,508,000 27,525,000 193,984,000 17,762,000 14,752,000 3,010,000 8,857,000 4,722,000 31,341,000 38,129,000 4,783,000 7,902,000 13,975,000 8,977,000 105,107,000 53,907,000 42,494,000 (6,617,000) 907,000 88,877,000 193,984,000 Standardized Quarterly Cumulative CF Report Date 10/02/2021 4th Quarter USD Not Qualified 10/03/2020 4th Quarter USD Not Qualified 09/28/2019 4th Quarter USD Not Qualified Currency Audit Status Yes Thousands 2,536,000 836,000 2,194,000 5,566,000 (3,578,000) Yes Thousands (2,442,000) 10,703,000 (645,000) 7,616,000 (4,022,000) Consolidated Scale Net Income (Cumu) Adjustments from Inc to Cash (Cumu) Change in Working Capital (Cumu) Cash Flow from Operations (Cumu) Purchase of Pty Plant & Equip (Cumu) Change in Business Activities (Cumu) Other Investing Cash Flows (Cumu) Cash Flow from Investing (Cumu) Change in LT Debt (Cumu) Change in Equity (Cumu) Payment of Dividends (Cumu) Other Financing Cash Flows (Cumu) Cash Flow from Financing (Cumu) Effect of Exchange Rate (Cumu) Change in Cash (Cumu) Opening Cash (Cumu) Closing Cash Depn & Amortn (CF) (Cumu) Net Purch of Pty Plant & Equip (Cumu) 407,000 (3,171,000) (3,699,000) 435,000 Yes Thousands 10,913,000 715,000 (5,644,000) 5,984,000 (4,876,000) (9,901,000) (319,000) (15,096,000) 3,677,000 318,000 (2,895,000) (1,564,000) (464,000) (98,000) 1,300,000 4,155,000 5,455,000 4,160,000 (4,876,000) 172,000 (3,850,000) 11,233,000 305,000 (1,587,000) (1,471,000) 8,480,000 38,000 12,499,000 5,455,000 17,954,000 5,345,000 (4,022,000) (1,121,000) (4,385,000) 30,000 (1,951,000) 17,954,000 16,003,000 5,927,000 (3,578,000)
Step by Step Solution
There are 3 Steps involved in it

Get step-by-step solutions from verified subject matter experts